Tuesday, June 01, 2010

Tony Dwyer Is Not Alone..........Of Course It Is Still A Good Time To Buy, Buy, Buy.....

What a "surprise"......Keep the following stats in mind when the daily spin "stocks are cheap on forward pe´s" is hitting the MSM... If you want to hear the "rationale" for a 2000 S&P target in 2013 visit Tony Dwyer & his "brilliant playbook" UPDATE: A guy named Altucher is almost as good It's Not a 'V', It's Even Better, Look for New Highs by 2012 .... There maybe are legitimate reasons to buy stocks, but a favourable opinion from "Wall Street Finest" should definitely not play any role among your screening process .... Except you use them as a "contrary indicator".... ;-)

Welch "Überraschung"......Behaltet die nachfolgenden Daten im Hinterkopf wenn es wie tagtäglich in den Medien und auch der Fachpresse gebehtsmühlenartig wieder heißt "das Aktien auf Bewertung der 2011er Gewinne günstig sind"..... Ein eindrucksvolles "Schauspiel" in dieser Disziplin bietet Tony Dwyer mitsamt seinem "brillianten Playbook" für sein 2000 S&P Ziel im Jahr 2013 UPDATE: Dieser Typ ist mindestens ebenbürtig It's Not a 'V', It's Even Better, Look for New Highs by 2012..... Grundsätzlich mag es ja durchaus gute Gründe die für Aktien sprechen geben, man sollte aber sicherstellen das die Einschätzungen der "Experten" beim Auswahlprozess keinerlei Rolle spielen....Es sei denn man nutzt sie als Kontraindikator.... ;-)


Bespoke
Bloomberg surveys sell-side Wall Street strategists on a weekly basis for their year-end S&P 500 price targets. At the start of 2010, the average year-end S&P 500 price target was 1,225, which would have been a gain of just about 10%. As markets moved higher in the first quarter, strategists upped their year-end targets, and the current average target stands at 1,268. (In the table below, green shaded price targets are ones that have been increased so far this year. No strategists have lowered their targets since the start of the year.) A target of 1,268 translates into a gain of 13.68% for the year and 16.48% from current S&P 500 levels.

There are no strategists with year-end targets that are lower than the index's current levels.
Analysts Projecting 27% Gain in S&P 500 Defy El-Erian Bloomberg

Combined price estimates from more than 2,000 forecasters tracked by Bloomberg show the S&P 500 will rise 27 percent in the next year, the fastest projected rate since February 2009, data compiled by Bloomberg show.

The rally above 1,350 will be led by industries most tied to the economy, according to analysts who boosted individual share projections by an average of 0.9 percent in May, the 14th straight monthly increase.

Should analysts’ forecasts for a 27 percent gain in the S&P 500 come true, the gauge would climb to 1,360 by next May, the highest level since June 2008.

The real story here are not the S&P 500 targets from the "strategist" but that they have managed to increase the target since the beginning of the year.... Despite events like the Flash Crash ( "Cancel All Orders, Cancel All Orders....." ), "minor headwinds" when it comes to Sovereign Debt,China , for US companies an unfavourable strong $ , impact from the "Oil Spill" on drillers & still insolvent Banks it´s fair to say that ROSE COLORED GLASSES are still a must have item among way too many among "Wall Street Finest"... ;-)

Die eigentliche Botschaft sind nicht die angegebenen Kursziele, sondern vielmehr die Tatsache das diese trotz einiger unschöner Ereignisse die vermehrt seit Jahresbeginn aufgetaucht sind wie dem sog. Flash Crash ( "Cancel All Orders, Cancel All Orders....." ), "minimalen" Problemen wenn es um Sovereign Debt,China den für US Firmen ungünstigen "starken $" , seit dem BP GAU die Probleme der Ölförderer & die immer noch bemerkenswert schwachen Banken geht, munter fleissig angehoben worden sind..... Denke es ist keine Übertreibung zu sagen das eine ROSAROTE BRILLE unter etlichen von "Wall Street Finest" noch immer zur "Standartausrüstung" gehört.... ;-)

I´ll let "Mr. Anti Spin" David Rosenberg du some further "bashing"..... Do yourself a favour & subscribe to his free DAILY REALITY CHECK... SUPERB!

Überlasse es "Mr. Anti Spin" David Rosenberg noch mehr Wasser in den Wein zu gießen....Empfehle allen sich frei Haus die tägliche Dosis Rosenberg zu genehmigen....

"It’s also fascinating to read the “Ahead of the Tape” column in the WSJ today and to read about the fabulous earnings performance of U.S. companies — a revival built on a weak U.S. dollar, accelerating global growth, fiscal stimulus and a steep yield curve.

Meanwhile, the consensus has just now gone ahead and projected peak earnings for 2011 just as each of these main crutches are reversing course."

AMEN....

McKinsey: Equity Analysts Are Still Too Bullish via Barry

Moreover, analysts have been persistently overoptimistic for the past 25 years, with estimates ranging from 10 to 12 percent a year, compared with actual earnings growth of 6 percent.

Over this time frame, actual earnings growth surpassed forecasts in only two instances, both during the earnings recovery following a recession. On average, analysts’ forecasts have been almost 100 percent too high.”

This chart completes the not so glory picture when is comes to the credibility & reputation from "Wall Street Finest".... If you have the "guts" to read the "rationale" behind Goldmans bullsih call you should read Goldman: "We Raised S&P 500 EPS Estimates Despite Worst May Performance In Almost 50 Years"

Dieser Chart paßt hervorragend ins Bild unm das das wenig glorreiche Bild abrunden....Für alle die die Nerven haben und wissen möchten auf welchen "Modellen" die Schätzungen von Goldman basieren Goldman sollte Goldman: "We Raised S&P 500 EPS Estimates Despite Worst May Performance In Almost 50 Years" lesen....

UPDATE:

Profit-Margin Outlook for U.S. Is ‘Extremely Bad’: Chart of Day Bloomberg

Best Stocks Liked Least by Analysts Missing U.S. Gain Bloomberg

Labels: , , , , ,

Monday, April 05, 2010

Profit Margins, Margin Debt & Margin Of Error.......

Combine the data points with the excellent When Risk-Return Makes No Sense: How To Deal With An Overvalued Market and it should be clear that Mr. Market is walking on very thin ice now... I must admit that this is my view since September/October......Cannot help but it at least smells a little bit like "Flucht In Sachwerte"... I still think that the risk / reward is far more favourable in GOLD... ;-)

Wenn man die folgenden Daten mit dem extrem lesenswerten When Risk-Return Makes No Sense: How To Deal With An Overvalued Market kombiniert wird klar das man sich momentan auf sehr dünnem Eis bewegt.... Muß gestehen das ich diese Ansicht seit dem September/Oktober vertrete.... So langsam kann man zumindest unterschwellig das Gefühl haben das zumindest in Teilen eine "Flucht In Sachwerte" eingesetzt hat.....Bin mehr denn je überzeugt das in Sachen Chance/Risiko die Aussichten für GOLD weitaus vielversprechender sind.... ;-)

William Hester / Hussman Funds
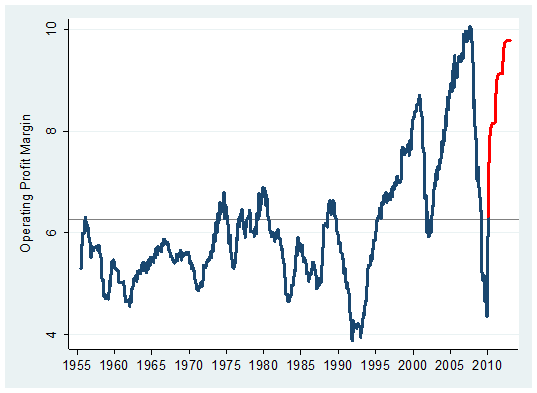
While earnings growth expectations are steep, sales growth expectations are more modest. Sales-per-share for S&P 500 companies is expected to grow about 5.5 percent this year and about 7 percent next year, according to forecasts. The difference between the growth rates of the top and bottom lines is implies a forecast for sharply rising operating profit margins. The graph below is updated from an earlier piece, and includes forecasts through the end of 2012. It plots the long-term level of S&P operating margins in blue. In red, I've plotted the operating margins currently being forecasted by analysts based on their projections for sales and earnings. Last October, analysts were about half way to pricing in profit margins that matched the record levels of 2007. Now, they are just about there.
David Rosenberg / Gluskin Sheff
As for 2011, the consensus is looking for $97 on S&P 500 operating EPS — we did $95 at the peak of the last cycle when the unemployment rate was at 4.5%, the industry CAPU rate was 81%, private sector credit xpanding at a 16.2% annual rate and nominal GDP at a 4.9% YoY pace.
So the consensus believes that barely two years into the second weakest post-recession recovery in the past six decades that we will actually get back to peak profit levels seems to be a tad outlandish.
Stock Market Rally Explained The Mess That Greenspan Made

Ad in the the Money & Investing section of today’s Wall Street Journal

Factoring in the tight junk spreads right now one must assume that looking at the next chart the "Margin Of Error" is probably "slim"......

Da momentan selbst historisch gesehen recht enge Junk Spreads vorherrschen muß man beim Anblick des nächsten Charts wohl unterstellen das in Sachen "Margin Of Error" wenig "Spielraum" bleibt.....

Investors really ♥ junk. We mean really. FT Alphaville

In most discussions of the high-yield bond market, historical spreads play a major role. But comparing spreads today to those of the past assumes that junk bonds are a constant entity over time. Unfortunately, junk is junkier today, as illustrated by this chart [at left] from last October’s Global Financial Stability Report.

The fraction of CCC or lower-rated bonds approximately doubled from early 2007 to early 2009. And according to a recent report from Fitch, the fraction at the end of 2009 was still 27%.

Debt ranked in the BB category gained 39.1 percent in the past 12 months, underperforming the CCC tier by 66 percentage points, according to Bank of America Merrill Lynch index data.


H/T EconomPicData

The "risk trade" is currently clearly not in the early innings....... Looks like the Mantra Bullish. No Matter What & the "Moon Trade" ( brilliant!) is still alive & kicking.... ;-)

Der sog. "Risikotrade" befindet sich sicher nicht mehr im "Anfangsstadium"..... Sieht so aus als wenn das Motto Bullish. No Matter What sowie Ladies and Gentlemen, We Are Trading On The Moon ( brilliant!) momentan noch immer zu greifen scheint...... ;-)+

UPDATE:

PARTS OF THIS MARKET ARE LOOKING IRRATIONAL PragCap

Why Young People Should Buy Stocks on Margin Time H/T Denninger

We just survived the worst debt-fueled binge since the Roaring '20s. Now two professors at Yale University are suggesting we introduce leverage into a new realm of our lives —our retirement portfolios. TIME's Barbara Kiviat asked economists Ian Ayres and Barry Nalebuff to explain themselves.

You are advocating that people in their 20s and early 30s take all of their retirement savings and buy stocks on margin. Can you explain why that's not as crazy as it sounds?

"It's not as crazy as it sounds because it helps people better diversify risk across time"

Read this twice....

UBS: EQUITY MARKET RISKS APPROACHING EXTREMES PragCap

Irrational Exuberance Is Here: VIX Lowest Since July 2007 As Options Speculation Highest Since Dot Com Days

The VIX has just hit the lowest level since July of 2007 as Sentiment Trader reports that "speculation in the options market has spiked to its highest levels since the spring of 2000."
As i´ve said, not in the early innings.....

Wie gesagt, nicht mehr im Anfangsstadium......

Labels: , , , , , , , , , , , , ,

Friday, October 09, 2009

Thank God There Is No Conflict Of Interest....... ;-)

Nothing really new but with the Dow probably hitting 10.000 on Monday i think it´s not a bad time to update the topic "Wall Street Finest" ....... Watch the red line......

Da der Dow wahrscheinlich am Montag die 10.000 knacken wird und auch ansonsten alle Märkte weltweit nahe Ihren Hochs stehen kann es nicht schaden erneut einen Blick die selbstverständlich "höchst wertvolle" Rolle der sog. Experten , oder wie von mir liebevoll als"Wall Street Finest" tituliert, zu werfen..... Man beachte die rote Linie....


‘Sell’ for Research Renegades Becomes Business Off Wall Street
Bloomberg

In October 2008, as the global financial system teetered on the brink of collapse, “sell” calls in U.S. markets constituted 6 percent of the total recommendations by analysts, with “buys” comprising 36 percent and “holds,” 58 percent, according to Bloomberg data.
Almost a year later, amid a stock market rally, the percentage of “buy” calls dropped: They made up 32 percent, with “holds” comprising 63 percent and “sells,” 5 percent, as of Oct. 8.

"Business as usual" ( across all segments ).....Now compare this kind of "wisdom" with the next report on valuations......

"Business As Usual" ( und das über alle Sektoren) ..... Vergleicht bitte die o.g. "Weisheit" mit dem folgenden Report zum Thema Bewertungen......

Special Report Valuation 100909


Mish

Even if one uses "operating earnings" a euphemism for "blatant lie" in which all "one-time losses" that recur like clockwork are ignored (along with everything else the companies want to ignore), the PE based clocks in at 29.64 as of the end of the third quarter according to S&P Earnings Data.

Forward Earnings Imply a Return To Near-Record Profit Margins Hester/Hussman

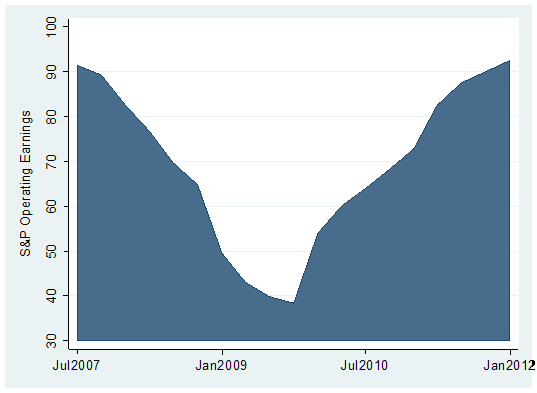
At these levels it seems that a full-blown V-shaped recovery is being priced in. There's no better example of a V-shaped forecast than for what is expected for the recovery in earnings over the next couple of years. The graph below shows the operating profit series, which includes actual results from the second quarter of 2007 – when earnings peaked – through this year's second quarter, and then continues with estimates through the end of 2011.

For operating earnings to get back to their peak levels, analysts have penciled in earnings growth of more than 40 percent over the next year, and then another 22 percent between 2010 and 2011

What is worth highlighting is that analysts expect that the typical company will soon achieve the same level of profit margin that they were able to deliver in the years leading up to 2007 – a period where leverage was preferred over balance sheet strength, a preference by company managements to focus on equity shareholders, during a political climate where labor lacked bargaining power, where consumer spending was fueled by mortgage equity withdrawals, and leverage ratios increased broadly because business and consumer credit was easy to come by.

To assume a return to peak profit margins is a bet that the economic and political landscape that emerges over the next year or two will match the pre-panic landscape perfectly.

But it is also important to keep this from Barry Ritholtz & Hester in mind......

In jedem Fall sollte man aber diesen Kernsatz von Barry Ritholtz & Hester im Hinterkopf haben.....

Barry: As noted previously, at times, things like “valuation” or the economy or earnings don’t matter — until they suddenly do.

Hester : While S&P earnings may not be able to rise to the lofty expectations of analysts over the next couple of years, this isn't a strongly bearish argument in itself. The link between near-term earnings and stock direction is tenuous. Outside of very large changes in earnings, there is essentially no correlation between year-over-year changes in earnings and changes in stock prices.

But if you're investor that is sensitive to valuation and your preference is to use forward earnings, then an understanding of the building blocks that create those earnings estimates is important.

Regardless of this rule the risk/reward ratio isn´t quite "favourable" ( i´m being polite ) right now...... But as long as the technicals are not breaking down it is still too dangerous to entry a short position...... Even if it is very tempting.... ;-) At least the first not insignificant signs are popping up that the party might be over rather sooner than later......At some point this kind of "wealth transfer" has to stop...... I´m pretty sure this guy will have lots of fun in 2010...... ;-)

Denke es bleibt in jedem Fall festzuhalten das das momentan vorhandene Chance/Risikoverhältnis nicht gerade vorteilhaft ( höflich vormuliert ) ist...... Solange die Markttechnik aber noch intakt ist sollte man auf jeden Fall der Versuchung widerstehen short zu gehen. Auch wenn das tagtäglich schwerer fällt...... ;-) Immerhin sind doch erste ernsthafte Anzeichen zu erkennen die andeuten das der Party bald der Treibstoff ausgeht.......Spätestens wenn diese Art von "Umverteilung notgedrungen Ihr Ende findet......Ich bin mir ziemlich sicher das dieser Typ spätestens im Jahr 2010 eine Menge Spaß haben wird...... ;-)

Labels: , , , , , , ,

Friday, May 01, 2009

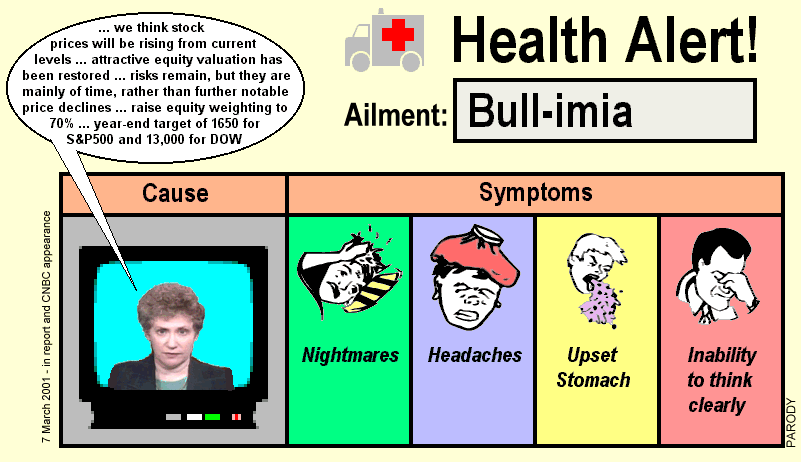
Abby Joseph Cohen 2009 vs Abby Joseph Cohen 2001.....Which Call Is Worse?

What´s a year without a "brilliant" call ( even more important the rationale behind the call ) from Abby Josef Cohen.....Just in time after a 30% plus (technical ) rally in the major indices worlwide.....In the past especially the calls from permabull Cohen were close to near and often long term market tops...... To my knowledge one of the better "contrary" indicators......

Was wäre ein Börsenjahr ohne Weisheiten von Abby Joseph Cohen.....Man beachte das brilliante Timing.... Rechtzeitig nachdem alle bedeutenden Indizes 30% und mehr gewonnen ( technisch bedingt ) haben..... Ein prima Kontraindikator. Die "Prognosen" vom Permabullen Cohen haben in der Vergangenheit zeitlich oft ein längfristiges Markthoch markiert...... Besonders wenn die Begründung für die avisierten Kursziele schon fast tragischkomischen Charakter haben bzw. man befürchten das die Schweinegrippe auch Wall Street erreicht hat...

Call 2001 just bevor the collapse:

bigger/größer

Hat tip Wall Street Follies

Call 2009 S&P 500 at 880:

Goldman Sachs’s Cohen Says S&P 500 May Surge to 1,050

May 1 (Bloomberg) -- The Standard & Poor’s 500 Index may jump 20 percent to 1,050 over the next six to 12 months as investors buy stocks trading at low valuations, said Abby Joseph Cohen, Goldman Sachs Group Inc.’s senior investment strategist.

> Low valuations....? "Fair value based on recession earnings" ( Quote Cohen ) ? She is probably using the following model showing the "high" quality of earnings ( backing out large parts of costs doing business like write downs, restructoring charges etc / see also the update at the end of the posting) or she is the only one thinking the Fed Model ( see "Fed Model" Knowing What Ain't True ) is usefull.....

> Niedrige Bewertungen.....? "Faire Bewertung die auf rezessionsgestählten Ergebnisprognosen basieren" ( Zitat Cohen )? Mag ja sein das sie Ihre Bewertungsmodelle auf der nachfolgenden Rechnungsmodellen basiert die an Kreativität ( "Sonderfaktoren wie Abschreibungen, Restrulturierungskosten usw werden ausgeklammert ) kaum zu überbieten sind ( siehe auch Update am Ende ). Denkbar auch das Sie als einzige dem Fed Modell ( siehe "Fed Model" Knowing What Ain't True ) glauben schenkt...........


“You could see the market sustain at these levels,” Cohen, 57, said in a Bloomberg Radio interview. “We’re going to set a new trading range much higher than the trading range in February and March.”

Cohen was replaced as Goldman Sachs’s chief forecaster for the U.S. stock market a year ago. She had been the second-most bullish Wall Street strategist at the start of 2008, a year when the S&P 500 tumbled 38 percent to 903.25 for the steepest annual loss in seven decades. Cohen predicted in December 2007 that the index would end last year at 1,675. David Kostin took her job.

At least i think her 2009/2010 call will be closer to the target than her over 40 percent miss for the 2008 December estimate...... :-)

Immerhin wird sie wohl Ihre 40% Zielverfehlung Ihrer letztjährigen Prognose verbessern können...... :-)

UPDATE:

This just in from David Rosenberg via Zero Hedge . I highly recommend to read the entire link. Compare this to the call from Cohen.....

Den nachfolgenden Link via Zero Hedge empfehle ich allen die das Kontrastprogramm zu Cohen lesen wollen. Eine realistische und fundierte Marteinschätzung von einem der auch die bisherigen Probleme vorhergesen hat ( David Rosenberg ).

The market, as a whole, cannot be considered cheap

In the meantime, earnings forecasts are being trimmed steadily for the balance of the year. In fact, forward P/E multiple of 15x operating and 30x on reported EPS are not that compelling. So, we do not have a strong valuation argument. We do not have a strong earnings argument.

Compare the following chart with the former S$P500 1675 target from Cohen......

Vergleicht den nachfolgenden Chart mit dem vorherigen Kursziel ( S&P 500 1675 ) von Cohen.....

via Chart Of The Day
While the stock market is up sharply since early March, the economy as well as corporate earnings continue to suffer. Today's chart helps provide some perspective as to the magnitude of the current economic decline. Today's chart illustrates that 12-month, as-reported S&P 500 earnings have declined over 90% over the past 20 months (with over 90% of S&P 500 companies having reported for Q1 2009), making this by far the largest decline on record (the data goes back to 1936). In fact, real earnings have dropped to a record low and if current estimates hold, Q3 2009 will see the first 12-month period during which S&P 500 earnings are negative.

Labels: , , , , , , , ,

Monday, October 08, 2007

Coal.com ..... / China

Wow! Does anybody need another example that it is never about valuations and it´s all about liquidity. The longer this run continues and the real interest rate for deposits in China is negative the more unlikely the following outcome will be like this........

Was für Fakten! Hier wird einmal mehr bestätigt das es an den Märkte in den wenigsten Fällen um die Bewertung geht. Die Liquidität dominiert fast immer das Geschehen. Je länger dieser Lauf weitergeht und die Regierung immer noch negative Sparzinsen zuläßt desto unwahrscheinlicher wird wohl folgendes Motto.......

China Shenhua Energy Shares Surge in Shanghai Debut
Oct. 9 (Bloomberg) -- China Shenhua Energy Co., the nation's biggest coal producer, almost doubled on its first day of trading in Shanghai after investors applied for a record 2.66 trillion yuan ($354 billion) of stock.

Shenhua rose as much as 91 percent after the Beijing-based company raised 66.6 billion yuan in the world's biggest share sale this year. Investors ordered 40 times the stock on offer, drawn by first-day trading gains for Chinese companies that averaged 269 percent in the past three months.

The surge gives the coal producer a market capitalization of $173 billion, surpassing Cia. Vale do Rio Doce as the world's second-biggest mining company. Shenhua will use the proceeds to buy mines and expand output to meet demand in the world's fastest-growing major economy, where coal prices have jumped to a record.

Thanks to Bespoke

The Beijing-based company sold 66.6 billion yuan of shares at 36.99 yuan apiece, a 19 percent discount to the closing price of its Hong Kong-listed stock yesterday.

Debut Gains
Shenhua's Shanghai shares are trading at 65 times estimated earnings. China Coal Energy Co., the nation's second-biggest coal producer, is trading in Hong Kong at 52 times last year earnings. Shenhua's Hong Kong shares are trading at a ratio of 42, less than the 54 times average for China's CSI 300 Index, the world's best-performing this year.

Shenhua sold 1.8 billion yuan-denominated shares. The sale surpassed the $8 billion raised by Russia's VTB Group in May. The amount is also a record for a domestic stock offering, exceeding the 58 billion yuan raised by China Construction Bank. .....

China, the largest miner and consumer of coal, became a net importer of the fuel for the first time in January, ending centuries of self-sufficiency and boosting benchmark prices of the fuel at home and at Australia's Newcastle Port to records in August. China burns coal to generate 78 percent of its electricity.

>For a more bullish view on the Chinese Economy (not the stock market) read How fit is the panda? from the Economist. Once in a month i need to post something positive excluding gold....... :-)

> Für einen eher positiven Ausblick für China´s Wirtschaft (nicht den Aktienmarkt) empfiehlt sich How fit is the panda? vom Economist. Ich muß ja zumindest einmal monatlich etwas bullishes ausserhalb von Gold posten...... :-)

AddThis Feed Button

Labels: , , , , ,

Thursday, October 04, 2007

Bad-News Bulls / Economist

This piece from the Economist sums it up. It´s always amazing to watch how quick sentiment can turn either way. It will be interesting to see what will be the trigger for the next "minor correction". I´ll bet that it has something to do with the coming CPI numbers....... One more chance for the bulls to "buy the dip"......

Dieser Bericht vom Economist faßt die Lage recht gut zusammen. Ich bin jedesmal wieder erstaunt und fasziniert wie schnell sich die Stimmung drehen kann. Ich bin gespannt welche Meldung der nächste Auslöser für eine erneute "kleine Korrektur" sein wird. Ich denke das es evtl. etwas mit den kommenden CPI Zahlen zu tun haben könnte.... Das wird den Bullen eine erneute Chance geben um nachzuladen. Evtl. mehr als Ihnen lieb sein wird..... ;-)

Bad-News Bulls / Economist
THE news seems to go from bad to worse. In late September figures showed that the American housing market was in free fall, with both sales and prices plunging. On October 1st Citigroup and UBS, two of the world's biggest banks, said they were writing down $9.3 billion of debt between them because of the credit crunch.

Global stockmarkets have reacted not with dismay but with euphoria. Wall Street marked the Citigroup write-downs by driving the Dow Jones Industrial Average to a record high (see chart). The MSCI emerging-markets index has soared to new highs. This summer's turmoil seems to have been completely forgotten.

What explains this apparent insouciance? It seems that investors reckon they cannot lose. “Take your pick,” says Gerard Minack, a strategist at Morgan Stanley: “Equity markets are either behaving as if the worst is over for credit and housing problems or they remain convinced that the [Federal Reserve] can offset whatever bad news may unfold.” In other words, bad economic news means the Fed will cut interest rates and good news means recession will be avoided.

There are some signs to support the idea that the worst might be over in the credit markets. After strenuous effort, banks have managed to find buyers for $9.4 billion of the $24 billion needed to finance the takeover of First Data, a payments processor, by Kohlberg Kravis Roberts, a private-equity firm. According to JPMorgan, even the structured products that caused so much disquiet during the summer are moving again—$6.2 billion of collateralised-debt obligations were issued in the last week of September.

Risk appetite is resurfacing in currency markets, too. The “carry trade”, the borrowing of low-yielding currencies to buy higher-yielders, is back in full swing; the Australian and New Zealand dollars have been surging. Having reached a 27-year high on October 1st, gold (often seen as a safe haven for nervous investors) suddenly lost 2.5% of its value in a day.

The bullish case seems fairly simple. The American economy may be slowing but the rest of the world, particularly emerging markets, can make up for it. As a result, corporate profits can continue to be strong. Profits forecasts are being revised down, but not dramatically so. The dollar's decline has added impetus to the earnings of American exporters and multinationals with overseas subsidiaries.

In this light, the credit crunch seems like old news. Even bank write-downs can be spun in a good light. Much of the panic in August was caused by fear of what banks had on their books; now the bad news is out, investors can relax.

In addition, many investors are looking back to 1998 when the Fed cut rates in response to a previous crisis in the finance industry—the collapse of Long-Term Capital Management, a hedge fund. The markets recovered quickly and the dotcom bubble reached its apogee. This time round, emerging markets (or even alternative energy stocks) might be the big winners.

> Here comes a slightly different view Emerging markets: an exhilarating, but potentially lethal, ride

> Hier eine leicht andere Einschätzung Emerging markets: an exhilarating, but potentially lethal, ride

And in the short term at least, money that was pouring into the credit markets is now being invested in shares.

But not everyone buys the bulls' arguments. Experienced observers of the debt market, such as Tom Jasper of Primus Guaranty, a credit insurer, think the crunch is far from over. According to Moody's, a rating agency, the spread (excess interest rate) of high-yield debt over Treasury bonds has fallen from the crisis peak but is far higher than it was in June.

In the quick-to-rollover money markets, there is still a much wider spread than normal between the rate governments must pay to borrow money and the rate which big banks have to pay. That indicates investors remain nervous about the extent to which banks are exposed to losses from subprime mortgages, or large private-equity borrowers.

Problems in the housing markets are far from over, too. The latest gloomy statistic to emerge was a 21.5% annual fall in pending American home sales, a figure that is a leading indicator for actual sales. House prices will surely fall further and defaults increase, as homeowners struggle to cope with higher mortgage rates from “teaser” loans taken out in 2006.

That may well have a depressing effect on consumer sentiment, something which the Fed's rate cut last month may do little to help. Normally, interest-rate moves take 12-18 months to work their way through the economy. In any case, mortgage rates are barely lower than they were a month ago. The American economy could yet slip into recession, an event on which Goldman Sachs now places a 40% probability.

Even the argument that corporate profits are still strong does not look completely convincing. American profits are close to a 40-year high relative to national output, according to Longview Economics, a financial consultancy. That suggests they should return to the mean, especially as the profit numbers taken from national-accounts data look a lot weaker than those reported by quoted companies. The last time such a gap appeared was in the late 1990s, an era of much creative accounting.

And while the weak dollar may be good news for American exporters, it is bad for European companies. Having been strong in the early part of this year, the latest data on European economies have weakened sharply; Nicolas Sarkozy, the French president, is not the only one concerned by the euro's strength. There is the potential for turmoil in the currency markets, either because Europe takes a stand against the rising euro at the Group of Seven finance ministers' meeting on October 19th, or because international investors, who have to finance the American trade deficit, become alarmed by the weakness of the dollar. Stockmarkets might be able to rise above the problems of the credit markets. But whether they could gain ground in the face of foreign-exchange market turmoil as well seems a lot more doubtful.

AddThis Feed Button

Labels: , , , , , , , ,

Wednesday, September 26, 2007

Earnings Quality Part XXIII........

Another example why you should read the earnings news especially from financial with great scepticism......Add this to the list of "creative accounting" like Negative Amortisation, Level 3 " Mark-To-Make-Believe Gains", Level 2 "Mark-To-Model", "Preferred Measurements Of Income", loan loss "politics" Part 1 & Part 2 etc.......
Einmal mehr Beleg dafür das man besonders die Ergebnisse der Finanzinstitute mit einer gewissen Portion "Skepsis" betrachten sollte......Hier ein paar weitere Beispiele die belegen das nicht wirklich "konservativ" bilanziert wird Negative Amortisation, Level 3 " Mark-To-Make-Believe Gains", Level 2 "Mark-To-Model", "Preferred Measurements Of Income", Risikovorsorge Teil 1 & Teil 2 etc.......
Brokers' Head-Scratcher / WSJ
Still, some investors remained concerned about earnings quality, in part, because the firms all benefited from a tumble in the value of their own debt. Accounting rules require firms to take a gain on such declines if they are applying market values to some forms of debt or financial instruments.

At Bear Stearns, the already dismal quarter would have been even worse without about $225 million in such gains. Morgan Stanley, which also had a rocky quarter, said it booked $390 million in such debt-related gains, while Goldman said it benefited from nearly $300 million in this way. Lehman didn't specify its gains, but said they helped lower to $700 million the hit the firm took from markdowns on loans and securities.
Hat tip to Barry Ritholtz
Keep this in mind when Wall Street is pointing to low pe´s......They also often forget to mention that financials are the biggest sector of almost every major US index....
Behaltet all das im Hinterkopf wenn der nächste Analyst mal wieder auf die niedrigen KGV´s verweist....... Zudem wird nur zu gerne unterschlagen das Finanzwerte der mit Abstand wichtigste Sektor aller US Indizes sind....
AddThis Feed Button

Labels: , , , , , , ,

Tuesday, September 04, 2007

Subprime Danger Limited - But What About Chinese Stock Market Exposure? / China

It´s yet time for another update on China. The FT is reporting some very interesting details on the earnings quality of Chinese companies. If you take this into account the PE that is calculated on the operating level would be far higher than the already sky high ratio. To my knowledge only Slovenia rivals China with an even higher PE. But as we all know it´s all about liquidity and most shares are probably still a better buy than Washington Mutual & Co .......

Es ist mal wieder Zeit für ein Update aus China. Die FT hat ein paar extrem interessante Details zur Gewinnqualität der chinesischen Firmen ausgegraben. Wenn man lediglich die operativen Gewinne zur Berechnungsgrundlage des KGV´s heranziehen würde kommt man zu einem noch deutlich höheren KGV als dies jetzt ohnehin schon der Fall ist. Nach meinem Kenntnisstand kann es z.Zt. lediglich Slovenien in Sachen astronomisches KGV mit China aufnehmen. Aber bei der Liquidität spielen Bewertungen momentan halt keine Rolle und ich würde immer noch fast jede chinesische Aktie lieber kaufen als zum Beispiel Washington Mutual & Co ....... But it could be that in China investors should be looking closer to home for worrying exposure inside the nation’s lenders and other companies.

Strong earnings growth in China has been used by some to justify the higher valuations there than elsewhere in Asia.
But, reports Jamil Anderlini in Tuesday’s FT, what if it turns out that growth is underpinned by the country’s soaring stock markets, rather than core profits?

Profits rose on average by 71 per cent in the first six months of the year for the more than two-thirds of listed Chinese companies that have already published results. But operational profit growth was only about 35 per cent, according to Jerry Lou, equity strategist at Morgan Stanley.

So up to half of the heralded earnings growth of companies listed in Shanghai and Shenzhen may have originated from piling into the country’s red hot stock market. Almost a third of those companies’ income in the first half was non-operational, up from 13 per cent in 2006, and much higher than most developed markets where non-core income usually accounts for less than 10 per cent of total profits.


And this is the market that sent Bank of China A-shares up 1.3 per cent at the end of last week on the back of news that it had $10bn of subprime exposure. BoC’s Hong Kong-listed H-shares fell about 6 per cent on the same announcement.

Financial companies derived 26 per cent of first-half profits from non-operational income in the first six months of the year, Anderlini adds, up from 8 per cent in 2006.

Subprime be damned - stock market exposure could spell quite some profits slowdown when the easy earnings evaporate.


Thanks to Bespoke

> Somehow this reminds me of the Nasdaq bubble when companies like Intel were reporting billions of profits from unloading some of their ( 12 month later worthless) venture capital investments via IPO. ....

> Irgendwie kommen bei mir da Erinnerungen an die wilden Nasdagzeiten hoch. Ich kann mich noch gut daran erinnern wie Firmen wie Intel Quartalsgewinne in Mrdhöhe dadurch erzielt haben das sie ihre ( im nachhinein wertlosen) Venture Capital Beteiligungen mittels eines IPO an den Markt gebracht haben ......
AddThis Feed Button

Labels: , , , , ,

Monday, September 03, 2007

The problem with financials / Hussman

It is not hard to understand why common sense from Hussman is obviously not good for the business of Wall Street. I wanted to add another point that doesn´t makes thing better. I think if the financials would be forced to account conservatively the lots of the earnings would fall apart. If you want an example of how "creative" this process has become make sure you read Wells Fargo Gorges on Mark-to-Make-Believe Gains

Es ist aus nicht weiter verwunderlich das der gesunde Menschenverstand der jede Woche von Hussman unters Volk gebracht wird nicht gut für das Geschäft von Wall Street ist. Ich habe noch einen Zusatz zum Report zu machen. Ich bin mir ziemlich sicher das die Gewinne schon jetzt deutlich geringer ausfallen würden wenn die Finanzkonzerne konservativer bilanzieren würden. Als anschauliches Beispiel wie weit die "kreative" Auslegung der Bilanzvorschriften inzwischen gediehen ist bietet sich dieser Link an Wells Fargo Gorges on Mark-to-Make-Believe Gains

The problem with financials
We continue to carry a very low weight in financial stocks. Though the recent weakness in these stocks has prompted a great deal of interest in “bottom fishing,” my impression is that such efforts are based on the same untempered assumptions of high and growing earnings in this sector that existed months ago. P/E ratios ought to be well below historical norms when those P/Es are based on record earnings and record profit margins. In my view, existing valuations are based on untenable assumptions of permanently high profit margins in this sector, with optimistic growth assumptions as well.

In 2000, this was the essential problem with the technology sector. It was some time before Wall Street's expectations caught up with the reality that profit margins are cyclical and that early declines off of overvalued peaks do not constitute bargains.

I expect that in the next year or two, we will observe at least one quarter, and more likely a full year, in which the entire profit of the U.S. banking sector is consumed by loan losses.

Consider, for example, the latest FDIC Banking Profile, which was published based on June 30, 2007 data (before the recent liquidity crisis emerged). In that report, the FDIC noted that the ratio of loan loss reserves to total loans remains at a 32 year low. As for the portion of those loans that are in trouble, the FDIC notes “for the fifth quarter in a row, reserves failed to keep pace with the increase in non-current loans.” The industry's “coverage ratio” of reserves to non-current loans fell to the lowest level since the third quarter of 2002, while non-current loans posted the largest quarterly increase since the fourth quarter of 1990. Recall that 1990 and 2002 were periods when recessions were already well underway. If we're already seeing these signs of credit stress at the peak of an economic expansion, the figures we observe in a recession are likely to be a lot worse.

> Make sure you read Is WaMu the Next Countrywide? to see how ugly the situation and the quality of earnings already is.

> Ich kann jedem empfehlen Is WaMu the Next Countrywide? zu lesen um zu verstehen wie übel die Lage selbst bei einigen großen Instituten inzwischen aussieht.

> The impact on total S&P 500 earnings is if you take this table from Bespoke already over 30 percent. I have seen charts that include the impact of the financial arms from companies like GE, GM, F, Harley etc and the number is closer to 30 perecnt and 40% of the profits. Either way you look at it this number is going to decline significantly.

> Der Gewinnanteil an den gesamten S&P 500 Gewinnen liegt wenn man nach der Übersicht von Bespoke geht bei über 30%. Ich habe auch schon Aufstellungen die zusätzlcih die Finanarme von GE, GM, F, Harley usw miteinrechnen. Dann verschieben sich die Zahlen Richtung 30 und 40 Prozent. Wie man es auch dreht und wendet diese Anteile werden sich in den nächsten Jahren massiv gen Spüden bewegen.

> Here Bear Stearns as an example. I´ll bet that the real number for 07 and 08 will be much lower. How can any Analyst come up with another conclusion is a mystery to me. They should know that Bear is viewed as the most vulnerable as it generated 44 per cent of its revenue from its fixed-income business, according to Bernstein Research. It also has least exposure to less troubled markets outside the US. Here is another good story why a slump in earrnings is very likely American Investment Banks "Shots In The Dark" Economist

> Nehmt Bear Stearns als Beispiel. Ich gehe jede Wette ein das die tatsächlichen Gewinne in 07 und 08 deutlich niedriger sein werden. Wie ein Analyst hier zu einer anderen Meinung kommen kann ist mir schleierhaft. Ich gehe davon aus das denen der Fakt bekannt ist das Bear 44% seiner Umsätze im Anleihebereich macht und fast ausschließlich auf die USA beschränkt ist. Hier ein guter Link der zeigt warum dei Gewinne aller Investmentbanken wohl demnächst deutlich niedriger ausfallen dürften. American Investment Banks "Shots In The Dark" Economist

EPS TrendsCurrent Qtr
Aug-07
Next Qtr
Nov-07
Current Year
Nov-07
Next Year
Nov-08
Current Estimate 2.323.1912.7313.62
7 Days Ago 2.783.4813.4314.47
30 Days Ago 3.364.0514.6915.76
60 Days Ago 3.394.0414.7215.78
90 Days Ago 3.504.2115.2815.95

> And when you look at this table of pending LBO deals via the NYT it should be clear that the investmentbanks are also facing "loan" trouble.....

> Und wenn man sich diese Übersicht der noch zu finanzierenden LBO Deals von der NYT ansieht kann man sich leicht ausrechnen das die Investmentbanken ebenso wie die gewöhnlichen Banken einige "Kreditprobleme" zu lösen haben.... The Banks Behind the Biggest Buyouts

James Grant put it this way – “Benjamin Graham and David L. Dodd, in the 1940 edition of their seminal volume ‘Security Analysis,' held that the acid test of a bond or a mortgage issuer is its ability to discharge its financial obligations ‘under conditions of depression rather than prosperity.' Today's mortgage market can't seem to weather prosperity.”

As of June 30, 2007, the net income of all FDIC insured banking institutions totaled $36.8 billion. At an annual rate, that represents about 2% of all loans outstanding. Meanwhile, net charge-offs for bad loans were already running at an annual rate of about 0.50% in June. That's in a strong economy, before the recent problems, and loan loss reserves didn't even budge from a 32-year low. Net charge offs could easily quadruple in a mild recession.

Importantly, the problems go far beyond sub-prime. In its June 30 report, the FDIC noted “all of the major loan categories posted both increased net charge offs and higher net charge off rates.” Overall, net charge-offs jumped by over 50% from year-ago levels, with a jump of over 60% for consumer loans and over 70% for industrial loans. These percentage jumps are so high because they are off of such a low base, which underscores the extent to which observed profits in the financial sector have been unhindered by loan losses in recent years. Charge-off rates have not soared as much for credit cards, but this is because the existing level of charge-offs is already high (representing over 3% of the total amount volume of credit card balances, year-to-date). In short, the problems are in all categories, and given the thin coverage of the banking system for such losses, rising charge-offs and loan loss reserves are likely to bite deeply into earnings.

For some financials, relatively high dividend yields are being touted as a measure of safety and quality for investors. The difficulty is that if earnings come under pressure, a greater share of earnings will be required to cover those dividends.

> Let us hope that the Analysts are not so far behind the curve as they were with the homebuilders Number Of The Day ....Earnings Estimates for Homebuilders..... But as i said before....Common sence isn´t good for business......

> Bleibt zu hoffen das die Analysten in diesem Fall nicht ganz so daneben liegen wie bei den Buildern Number Of The Day ....Earnings Estimates for Homebuilders..... Wie ich aber schon vorher angemerkt habe ist der gesunde Menschenverstand nicht förderlich um Geschäfte an Wall Street zu machen.....

Now the bust is taking a brutal toll. In January, industry analysts predicted that the 10 biggest builders would have average earnings per share of $3.69 for 2007; the latest forecast is for a loss of $1.18.

Of course, the long-term return is equal to the dividend yield plus the long-term growth rate of dividends. Though I don't expect forced dividend reductions for major U.S. bank stocks, I do believe that the growth rates assumed by Wall Street here are overstated. And while a well-covered dividend can produce a lower “duration” and therefore a smaller sensitivity to broad market fluctuations, it does not in itself produce an undervalued stock. ....

In any event, my impression is that the problems for financials are just beginning, and that the risk premiums demanded by investors are likely to rise. As investors have seen throughout market history, stocks having rich valuations, weakening fundamentals, and rising risk premiums typically don't constitute great bargains.

> Now compare this to the "call" from Wall Street finest.... They obviously didn´t use any realistic earnings estimate. The only way they can justify this target is probably the "Fed Model". But as Hussman also has pointed out in "Fed Model"Knowing What Ain't True every body that has to use this argument is at best clueless (try to stay polite)........

> Nun vergleicht diese Aussagen mal mit den unvermeindlichen Zielen und Prognosen für den S&P 500. Anhand von realitischen Gewinnschätzungen sind diese Ziele sicher nicht erstanden. Die einzige Erklätung wäre das das brüchtigte "Fed Model" eine gewichtige Rolle gespielt hat. Wie abermals Hussman in "Fed Model" Knowing What Ain't True geschrieben hat ist jeder der dieses Argument heranzieht im besten Fall ahnungslos ( höflich formuliert).......

Disclosure: Short KBW Mortgage Finance Index

AddThis Feed Button

Labels: , , , , , , , ,

Thursday, August 23, 2007

P/E Ratios: Nasdaq vs China / Bespoke

It´s all about liquidity........We can see the opposite effect from liquidity in the worldwide credit markets.

And it doesn´t help when the central bank is offering deposit rates that are lower than the inflation rate..... At least they try to ease the pressure and now want to open the gates to investments in Hong Kong.

Liquidität, Liquidität, Liquidität......Wir alle können momentan an den weltweiten Kreditmärkten sehr schön sehen wie das Gegenteil von zuvile Liquidität aussieht.

Und es auch nicht gerade nachteilig wenn die Notenbank den Einlagenzinssatz unterhalb der Inflation festsetzt.....Immerhin wird jetzt versucht einen Teil der Liquidität nach Hong Kong umzuleiten .

> Just to clarify : a red quote in China represents rising prices.

> Nur zur Klarstellung : Rote Symbole stehen in China für steigende Kurse

In the past we have made comparisons between the p/e ratios of the Nasdaq Composite and China's Shanghai Composite. Up until mid-July when US equity markets peaked, the price to earnings ratios on the two indices were very similar, and the argument could be made that even though China's stock market was rapidly increasing, its valuation - while high - was still inline the Nasdaq's.

Since mid-July, however, the two p/e ratios have diverged dramatically as the prices on the two indices have moved in opposite directions. The trailing 12-month p/e ratio on the Nasdaq is now 35.88 while the p/e on the Shanghai Composite is now 49.57.

> But probably still better value than a Washington Mutual with a forward p/e ratio of 10.... :-)

> Wahrscheinlich sind selbst diese Aktien noch immer werthaltiger und günstiger als Washington Mutual die ein 2008 KGV von 10 aufweist.... :-)
AddThis Feed Button

Labels: , , , ,

Sunday, July 29, 2007

Market Internals Go Negative / Hussman

Last week could have been the turning point for the broader markets. I have to admit that i have thought this at least twice in the 6 month. And you know how much fear is in the market when there is a call for the Fed to step in when the markets are just a few percentage points away from a new high. Click on the headline to read the entire piece from Hussman

Habe das Gefühl das die letzte Woche einen Wendepunkt für die Märkte eingeleitet hat. Ich muß aber auch zugeben das ich dieses Gefühl bereits mindestens zweimal in den vergangenen 6 Monaten hatte. Und ein sicheres Anzeichen wie verzweifelt einige Marktteilnehmer sind ist das bereits bei einem überfälligen Pullback von nahe 5% lauthals nach der Fed gerufen wird. Klickt bitte auf die Überschrift um den kopletten Bericht von Hussman zu lesen.

Though the S&P 500 is only 6% below its recent highs, it has already provoked a surprising amount of denial and lack of civility, with an irritated financial news anchor suggesting on Friday, for example, that Pimco's Bill Gross should “just shut up.” It does no service to investors when the media and the analysts who appear there wholly rule out any possibility of a substantial further market decline, when 10% market losses have typically occurred more than once every 2 years, and bear market losses (generally 25-35%) occur about once every 4-5 years.
Abrupt market weakness is generally the result of low risk premiums being pressed higher. There need not be any collapse in earnings for a deep market decline to occur. The stock market dropped by half in 1973-74 even while S&P 500 earnings grew by over 50%. The 1987 crash was associated with no loss in earnings. Fundamentals don't have to change overnight. There is in fact zero correlation between year-over-year changes in earnings and year-over-year changes in the S&P 500. Rather, low and expanding risk premiums are at the root of nearly every abrupt market loss.

Market internals go negative
One of the best indications of the speculative willingness of investors is the “uniformity” of positive market action across a broad range of internals. Probably the most important aspect of last week's decline was the decisive negative shift in these measures. ....Still, the favorable market internals did tell us that investors were still willing to speculate, however abruptly that willingness might end.

Evidently, it just ended, and the reversal is broad-based. For example:
Credit spreads and credit default swap spreads are surging. While we haven't observed the spike in short-term spreads (e.g. 6 month commercial paper versus 6 month Treasury yields) that would indicate near-term recession risks, we are now seeing a “tiered” widening of credit concerns. For example, note that high yield (junk) securities have experienced upward yield pressure since early June (red line). In recent weeks, we've seen a spillover into credit spreads on investment grade securities (blue line). Again, we're not observing this in short-dated spreads, which would be a signal of imminent recession risks, but it's already clear that low risk premiums are being pressed decisively higher.....

As Jim Stack of Investech Research noted near the recent highs, “The DJIA has closed higher in 5 of the past 8 trading days, but declining stocks outnumbered advancing stocks in 7 of 8 of those sessions. That type of negative breadth divergence has occurred only 15 times in 75 years – the majority of which were in bear markets.” He also noted “On Monday of last week, the DJIA hit a record high while declining stocks overwhelmed advancing stocks by a 2:1 margin.” That divergence has never before occurred in market history, though again, lesser divergences have typically been characteristic of weakening markets. ....

Other interesting measures of “overbought” conditions are also worth noting. Last week, Jim Stack reviewed an observation that a technician named Don Hahn made in the 1960's about the Coppock Guide (a measure of price momentum based on the 10-month smoothing of the averaged 14-month and 11-month rate of change in the S&P 500). He observed that when a double-top or “wave” occurs in this measure, without falling to zero between those peaks, “it identifies a bull market that hasn't experienced any normal, healthy washouts or corrections. That's a runaway market usually headed for disaster. This double-top has occurred only 6 times in 80 years.” Those instances, and the subsequent market losses were:

  • October 1929 (-86.2%),
  • May 1946 (-28.8%),
  • February 1969 (-36.1%),
  • January 1973 (-48.2%),
  • September 1987 (-33.5%),
  • and April 1998 (though followed by an 18% market correction by October 1998, the subsequent recovery produced a third “shelf” in the Coppock Guide by 2000, and the market lost nearly half its value between 2000 and 2002).

I don't want to create any confidence that the market is headed for steep losses, but I do want to encourage shareholders not to rule out that sort of outcome. .... AddThis Feed Button

Labels: , , , , ,

Sunday, July 15, 2007

A Who's Who of Awful Times to Invest / Hussman

Interesting list from Hussman. Too bad that you never hear such statistics on the MSM and it is always a good time to buy......Click on the headline to read the entire Piece.

Mal wieder Zeit etwas Wasser in den Wein zu gießen. Klickt bitte auf die Überschrift um den kompletten Bericht von Hussman zu lesen.


December 1961 (followed by 28% market loss over 6 months)

January 1973 (followed by a 48% collapse over the following 20 months)

August 1987 (followed by a 34% plunge over the following 3 months)

July 1998 (followed abruptly by an 18% loss over the following 3 months)

July 1999 (followed by a 12% loss over the following 3 months)

December 1999 (followed by a 9% loss over the following 2 months)

March 2000 (followed by a 49% collapse in the S&P over the following 30 months)

The defining characteristics of these instances were:
1) price/peak-earnings multiple above 18

2) 4-year high in the S&P 500 index (on a weekly closing basis)

3) S&P 500 8% or more above its 52-week moving average (exponential)

4) rising Treasury and corporate bond yields

Depending on how we define the interest rate trends, we can include two additional historical instances of these conditions: October 1963 and May 1996, both closely followed by 7-10% corrections.

One more instance completes the list: July 2007.

....It's extremely important to emphasize that I am not making a forecast or a “bearish call.” ....

The point of this analysis is instead to emphasize that based on prevailing market conditions, we have no evidence on which to accept market risk here. There is no need to forecast a decline – it is enough that, on average, the market has lagged Treasury bills in conditions similar to the present (though the skew, depth and abruptness of the historical losses in this case are striking). No evidence to take market risk, no market risk taken. It's that simple. ....

Frankly, I don't know whether investors will drive the market even higher in the weeks ahead. My opinion is that whatever gains emerge (and indeed, much of what has already emerged) will ultimately prove quite temporary. What I do know is that certain factors have reliably identified egregiously bad times to accept market risk, and that every historical instance similar to the present has been a disaster. The current instance may very well prove to be the exception, but I do not invest shareholder assets on the hope that the future will be entirely at odds with all available historical evidence. .....
AddThis Feed Button

Labels: , ,

Sunday, July 08, 2007

Stock Market Valuations Round Trip / Bespoke

Time for a p/e round trip about the globe. Bespoke has some excellent insights. Here is another country that is "beating" even China and the Nasdaq. I also recommend the latest piece from Hussman about the "Fed Model". Here is the data for the Russel 2000. No bargain.....Especially when financials are the largest sector.......

Es kann nicht schaden sich mal wieder einen Überblick in Sachen Bewertungen zu verschaffen. Unter den o.g. Links sind noch Informationen zu anderen Märkten sowie eine Einschätzung von Hussman zum sog. "Fed Model".

There seemed to be quite a bit of interest in our post yesterday about China's Shanghai Composite now having a lower valuation than the Nasdaq. Below we have updated our chart of current P/E ratios for the major indices of selected countries. As shown, the Nasdaq currently has the highest trailing 12-month P/E of the countries we analyzed. The Netherlands, Germany and the Euro Stoxx Index have the lowest valuations


Looking at estimated P/E ratios for the current year, we see that Japan's Nikkei-225 Index is the highest, while the UK's FTSE 100 is the lowest.
Photo

We continue to get a large number of requests for current financial ratios of sectors and indices. For your convenience, we have updated them for the ten major US sectors below. Numbers highlighted in green are better than the S&P 500 and numbers highlighted in red are worse. Currently, the Consumer Discretionary sector has the highest 12-month trailing price to earnings ratio, while Energy has the lowest. Not surprisingly, the Utilities sector offers the highest yield at 3.00%, while Technology offers the lowest at 0.58%. Photo

>Here is a different view that is not based on pe´s. When you look at the cash flow multiple for the "cheap" european stocks you will be suprised to see that they are reaching new highs. But when at the same time buyouts ( Hilton at 10 times, Hilton 14,5 times) are topping even this lofty multiple the bulls will argue that there is still more upside. Good luck......

>Hier ein etwas andere Blickwinkel der mal nicht das KGV als Grundlage nimmt. Nimmt man den Cash-Flow als Maßstab sind selbst die angeblich so "billigen" europäischen Aktien nicht mehr ganz so günstig wie evtl. das nackte KGV suggeriert. Au der anderen Seite kann man als bullishes Argument sicher anführen das die letzten großen Übernahmen alle ein 10 faches ( Huntsman, Hilton ) des Cash-Flows gezahlt haben. Viel Glück......


AddThis Feed Button


Labels: ,

Interest Rate Intuition / Hussman On The "Fed Model"

Excellent anti spin from Hussman. Keep this in mind when the "eyperts" try to spin bad economic news into gold (lower yields, higher stock prices) . Hussman shows that this is in the longe term just bubbletalk. But i have the feeling that long term is today often viewed until the next jobs report, the next cpi number etc...... Click on the headline to read the entire report
Großartiger Bericht zu dem oft zitierten "Fed Model" von Hussman. Man sollte die "Experten" nicht für voll nehmen wenn Sie dieses Argument undifferenziert bringen. Das passiert immer dann wenn schlechte Daten in positive für die Börsen umgedeutet werden (niedrige Renditen, steigende Aktienkurse). Hussman zeigt sehr schön das dieses Argument langfristig aus dem Reich der Fabel stammt. Da ich aber eh immer mehr das Gefühl habe das langfristig heutzutage (speziell in den USA) häufig nur bis zum nächsten Arbeitsmarktbericht, der nächsten Fed Sitzung etc bedeutet....... Klickt bitte auf die Überschrift um den kompletten Bericht zu lesen
It continues to fascinate me that investors are entirely willing to base their financial security on concepts that can be wholly disproved with even a cursory look at historical data. The Fed Model is the predominant example of this at present. The following chart should be sufficient to reiterate that the effect of interest rates on stock valuations is vastly overrated, and that raw earnings yields (particularly based on peak earnings to date) explain subsequent market returns far better than indicators that “adjust” for interest rates in the way the Fed Model does.

The truth is that the relationship between stocks and interest rates is far more nuanced than the Fed Model assumes.

Since 1950, the average yield on the 10-year Treasury bond has been just below 6%, while the average price/peak earnings multiple on the S&P 500 has been slightly over 14. For simplicity, we'll use those levels to define bond yields as “low” or “high” and to define stock valuations as “cheap” or “expensive” relative to long historical averages. Also for simplicity, we'll classify interest rates as “falling” when the 10-year Treasury yield is below its level of 6 months earlier, and “rising” otherwise.

Our intuition should immediately suggest that stocks probably perform best when valuations are cheap and interest rates are both low and falling. We should also expect that such favorable conditions would not have been observed too often. As it happens, that intuition is correct. That combination of conditions has historically occurred only about 7% of the time, but during those periods, the S&P 500 has achieved average annualized returns of 31.72%.

In contrast, our intuition should suggest that stocks probably perform worst when valuations are expensive and interest rates are both high and rising. Again, that intuition is correct. Such a combination of conditions has historically occurred about 10% of the time, and during those periods, the S&P 500 has achieved average annualized returns of 3.05%, clearly below Treasury bill yields, and generally with a great deal of volatility as well. When interest rates have been high and rising, the total return on the S&P 500 has been muted at about 4.00% annualized even when stocks have been relatively cheap.

Low interest rates are no panacea
Beyond those conditions, however, the intuition of the typical investor is likely to be badly off the mark. The reason is that investors have come to believe that low interest rates are a good thing for stocks in general, when in fact they are only a good thing if stock valuations are cheap. Importantly, low interest rates are of no help to stocks when stock valuations are rich. Contrary to the bad intuition that the Fed Model instills in the minds of investors, relatively low interest rates (at least on the basis of 10-year bond yields) are not nearly sufficient to justify or offset the negative effect of rich stock valuations. ....

In general, high stock valuations coupled with low interest rates (as we have now) have historically been symptomatic of a fully priced, overly optimistic market, with little margin for error.

With stock valuations rich, interest rates still relatively low but clearly rising, just 18% of investment advisors bearish, and short-term trends overbought, my hope is that investors do not allow the excitement (or frustration) of a market near new highs to obscure the very real danger here for long-term investors.


AddThis Feed Button

Labels: , , , ,