Monday, January 04, 2010

Anti Spin From Rosenberg

Time for a reality check ....Especially with markets at new highs, priced for perfection, investor sentiment ( Chart from December ) & complacency at "extreme" levels & quite a steep "Wall Of Worries" (H/T Zero Hedge) signalling at least not insignificant headwinds ..... UPDATE: Not a Positive Economic Picture M. Panzner .....

"Rosenberg Warning" ..... Make sure you don´t miss Know Your Market Bears – A Field Guide via The Reformed Broker...Hilarious :-)!

Denke die Zeit für einen Realitätscheck .... Gilt besonders da der Start ins Jahr 2010 neue Rekorde gebracht hat und die Bewertung nahe ( jenseits ) der Perfektion gepreist ist, die Stimmung der Investoren ( Chart aus dem Dezember ) & "Selbstzufriedenheit" schon leicht "euphorische" Tendenzen anzeigt und etliche andere Faktoren zukünftig zumindest erheblichenGegenwind versprechen......UPDATE: Not a Positive Economic Picture M. Panzner

Verweise weil es sich um Rosenberg handelt "warnenderweise" :-)! auf Know Your Market Bears – A Field Guide via Reformed Broker....Wunderbar :-) !


Breakfast With Dave 102609 Top


David Rosenberg

"So this remains the Houdini rally — no jobs; no pricing power; no broad participation; and no volume "

Hussman

"Over the past decade, the stature of the market as an effective discounting mechanism has gradually eroded. The observation and analysis of potential risks – though essential to long-term investing and loss avoidance – is far less actionable than one might expect. Investors will evidently speculate as long they have dice in their hands and the casino is not visibly on fire."
Bob "The Bear" Janjuah FT Alphaville

Well I clearly underestimated the ability & willingness of the Public Sector, notably in the UK, US, parts of periph Europe and Japan, to take huge risks with their sovereign balance sheets, AND IMPORTANTLY, I over-estimated the ability & willingness of the Financial Sector/Market to see things for what they are (Another Debt Fuelled Bubble/Ponzi).
The THE ULTIMATE GUIDE TO 2010 INVESTMENT PREDICTIONS AND OUTLOOKS compilation from PragCap gives numerous market calls from the "Who Is Who" and is a must read! Brilliant!

Wer einen fast kompletten Überblick von allen wesentlichen Adressen der Finanzwelt in Sachen Ausblick haben möchte der sollte THE ULTIMATE GUIDE TO 2010 INVESTMENT PREDICTIONS AND OUTLOOKS von PragCap nicht verpassen. Fantastisch!

But with Bernanke, Geithner, goverments, regulators & central banks around the globe playing the moral hazard card almost on a daily basis ( The Fed Is Preparing QE 2.0, MBS-Only Edition) without being punished significantly from bond & currency markets the party can easily continue for a while..... One of many many reason why i´m a GOLD-BUG .... ;-)

Da Bernanke, Geithner, Aufsichtsbehörden, Regierungen und Zentralbanken rund um den Globus die "Moral Hazard" Karte praktisch tagtäglich ( siehe The Fed Is Preparing QE 2.0, MBS-Only Edition ) in den Ring werfen ohne ernsthaft vom Anleihe und Währungsmarkt "getadelt" zu werden ist nicht auszuschließen das die Party noch ne Zeit lang weitergeht...... Einer von etlichen Gründen warum ich als GOLD-BUG durchgehe .... ;-)

Labels: , , , , , , ,

Friday, December 04, 2009

Market Quotes From Rosenberg & Hussman

The quotes along with the cartoon reflect pretty much my market outlook ...... Be very careful if you are long ( congratiolations to the courage ) this market...... I´m still sticking with my view that from a risk/reward perspective it makes no sense ( Goldman & BofA Merrill Lynch & JP Morgan & John Paulson beg to differ...... ) to invest ( long term exception Gold, short term it looks a little bit crowded ) in this market. Most Insiders ( Ratio 98:1 ) are also a lot more "cautious"......... And everybody pointing out to the "strong" jobs report on Friday as a sign that fundamentals are playing catch up with this "priced for v-shaped-perfection market" again should take a look at this amusing clip :-)

Die beiden Zitate zusammen mit dem Cartoon geben ziemlich genau meinen Marktausblick wieder.... Denke das jeder der momentan noch investiert ist ( Glückwunsch für den Mut ) sehr wachsam sein sollte...... Ich bleibe dabei das es bereits seit einiger Zeit unter Chance/Risikogesichtspunkten keinen Sinn ( Ausnahme langfristig Gold, kurzfristig sieht es allerdings etwas überhitzt aus ) mehr macht in diesen Märkten zu investieren ( Ganz im Gegenteil zu Goldman & BofA Merrill Lynch & JP Morgan & John Paulson .... ). Die Insider schließen sich bei einen es bei einem Verhältnis von 98 zu 1 eher meiner Meinung an.......Für alle die im Arbeitsmarktbericht vom Freitag die Wende zu besseren Fundamentaldaten erkannt haben wollen die dringenst benötigt werden um den bis zur perfekten V-Shaped Erholung bewerteten Markt auf ein noch steileres "V" zu treiben dem empfehle ich einen Blick auf diesen wirklich gelungenen Clip werfen ;-)

David Rosenberg

"So this remains the Houdini rally — no jobs; no pricing power; no broad participation; and no volume "

Hussman

"Over the past decade, the stature of the market as an effective discounting mechanism has gradually eroded. The observation and analysis of potential risks – though essential to long-term investing and loss avoidance – is far less actionable than one might expect. Investors will evidently speculate as long they have dice in their hands and the casino is not visibly on fire."

Labels: , , ,

Thursday, November 05, 2009

"The New Bubble Is In Stimulants....." Rosenberg

I want to add that the bubble is also in outright & hidden bailouts.....Nothing really new but hours/days away from the next mega bailout ( FHA ) a sober summary how wasteful the resources are "squandered"......

Finde zudem das man der Überschrift von Rosenberg noch hinzufügen sollte das es eine Blase in Sachen unverblümten und verschleierten Bailouts gibt..... Nichts wirklich neues, aber im Angesicht des nächsten unmittelbar anstehenden Megabailouts ( FHA ) eine wirklich deprimierende Zusammenfassung wie sinnlos unvorstellbare Summen verschleudert werden.....

H/T Gary Varvel

Rosenberg

So the U.S. economy is growing again. But how can it not be growing with all the dramatic stimulus? The question should be “why only 3.5%”?
> If you can stand more details you can read "A Sham GDP For A Sham Economy"......

> Für einen teiferen Einblick was die USA veranstalten müssen um überhaupt ein positives GDP Ergebnis auf die Beine zu stellen kann das in "A Sham GDP For A Sham Economy"...... nachlesen....
Now the U.S. government is going to not just extend but indeed expand the tax credits for homeownership. This is happening at a time when the fiscal deficit is 10% of GDP. Simply amazing. The sector already receives more in the way of government support than any other area, and it adds zero to the capital stock or productivity growth. Oh, but it makes us better citizens. Renting must be for losers.

And then we see that the Fed’s TALF (Term Asset-Backed Securities Loan Facility) program that began in March just broke the $90 billion mark. This has basically supported 75% of the growth in the asset-backed market, almost evenly split between auto credit and credit cards because at over a 130% household liability-to-disposable income ratio, the government seems to believe we don't have enough debt on our balance sheets. Honestly — you can't make this stuff up.

But here is the real kicker. The Federal Housing Authority (FHA). If you’re wondering how it is that the U.S. housing market has managed to rise from the ashes, well, consider that the government-insured FHA program moved into high gear this year and has basically filled the gap vacated by the private sector.

[No Easy Exit for Government as Housing Market's Savior]

The efforts to allow practically anyone to secure a mortgage not just for a new purchase but for refinancing purposes (where default rates are really becoming a problem) should not go unnoticed (and they weren’t by the staff at the WSJ that uncovered the growing problems in yesterday's edition — FHA Digging Out After Loans Sour on page A2).

[Bigger Burden chart]

The efforts to stimulate were so profound that the damn-the-torpedoes-full-steam-ahead policy has resulted in an expected 24% default rate on loans originated in 2007, and 20% for 2008. So, what has happened is that the taxpayer has taken over the bad lending decisions that were Wall Street’s domain three, four and five years ago.

>The following chart is from the must read Quote Of The Day..... "The Defaults Are Worth It " Guess who said this......

>Der nachfolgende Chart stammt vom unbedingt zu lesenden Quote Of The Day..... "The Defaults Are Worth It " . Gut zu wissen das der Typ der dieses Zitat gebracht dem Bankenausschuß vorsteht......

[FHA Chart]

Indeed, the FHA began its aggressive moves to support the housing market in 2007 and has since spread its tentacles

According to the WSJ, the FHA is going to publish a report acknowledging that it may need to tap into general tax revenues for the first time in its 75 year history. Oh, but don’t worry, FHA officials say the agency has enough capital to withstand any expected losses.

> I think David missed the "surprising" news that the FHA Delays Fiscal Report . The only question is now how "shocking" & "surprising" the multibillion $ bailout will be...... Cannot wait to hear Barney Frank´s "outrage" ( "The Defaults Are Worth It " ) .........

> Ich denke Davis hat diese "überraschende" Meldung von heute übersehen das die FHA den Fiscal Report "verschiebt". Fragt sich nur wie "schockierend" & "überraschend" der sicher zweistellige Mrd $ Bailout sein wird...... Am lautesten wird sich sicher Barney Frank aufregen ( "The Defaults Are Worth It " ) ......

The FHA began its aggressive moves to support the housing market in 2007 and has since spread its tentacles. The FHA actions, foreclosure moratorium and tax credit have all given a false impression that we have seen a bottom in residential real estate.

But all that’s happened here is the risks have been transferred to the public sector balance sheet. The share of FHA-insured borrowers with a sub-600 FICO score has rapidly approached the 40% mark. So, we have stimulated a recovery by inducing more bad debt accumulation, which got us into trouble to begin with. But it’s not Wall Street taking on the risks now, its Capitol Hill.

This is an effective way to fight a credit collapse? No wonder global central banks are diversifying into gold. The U.S. is hardly going to pay for this by raising taxes (the newly emboldened GOP will see to that) nor by cutting spending (the union lobby groups won't stand for that). Moreover, we'll have to assume that global central banks are not stupid and can see the future supply of dollars that will be printed to fund all these initiatives.

All this must be part of the famous "strong $ policy"........ ;-) Good to be a GOLD-BUG......

Denke all dies ist Ausdrück der berühmt berüchtigten "strong $ policy" der USA..... ;-) Da weiß man doch gleich wieder warum ein bekennender GOLD-BUG ist......

UPDATE:

Fannie Mae: $18.9 Billion Loss, Requests Another $15 Billion CR

Total nonperforming loans in our guaranty book of business were $198.3 billion

In the past year, the government has invested more than $110 billion in Fannie and Freddie, and it has pledged to invest as much as $200 billion in each company to keep them afloat.

[Seeking Shelter chart]

$45 Billion Boondoggle of Which $33 Billion Goes To Homebuilders Mish

It would loosen tax rules for homebuilders and other money-losing companies to let them claim an estimated $33 billion in tax refunds this year, according to Joint Committee on Taxation estimates.

The most galling thing about it is $33 billion of the $45 billion is not going to do anything but pad the pockets of those who helped create this mess. A mere $2.4 billion was given to extend unemployment benefits.

If Goldman Sachs is correct (and I believe they are), then most of the $10 billion in tax credits is a waste as well. Moreover, we have a huge inventory of homes already and we are creating incentives to build more.

The whole thing reeks and the Senate knows it. Note that Senator Christopher Bond called it a waste of money but there was not a single "No Vote". The bill passed 98-0 undoubtedly because the homebuilders padded the pockets of those voting for it with campaign contributions. This is the way Congress "works".

You cannot make this up...... This explain why i have the "Banana Republic Watch" label tagged to this post.... ;-)

Erklärt warum ich diesem Post das Prädikat "Banana Republic Watch" zugeteilt habe......;-)

Labels: , , , , , , , , ,

Tuesday, October 27, 2009

Scarcity. That Is The Answer To The Question “Why Gold?” End Of Story !

The headline is from the latest David Rosenberg piece ( as always much needed ANTI SPIN ) and sums up the some of the reasons (here is another good overview, thank god that at least the banks are "well capitalized"...... ) why Gold should outperform for some time to come ( not so sure obout the short term )....... Especially when one of the biggest headwinds during the past decades is becoming a tailwind ( see Central Banks Net Buyers Of Gold....... )

Die Überschrift stammt aus dem letzten Report von David Rosenberg ( dringend benötigter ANTI SPIN ) und faßt einige der Gründe ( hier noch ne nette Übersicht., da kann man ja von Glück sprechen das zumindest die Banken ""well capitalized" sind...) dafür zusammen das Gold auch weiterhin outperformen wird ( kurzfristig bin ich mir da weit weniger sicher ) ..... Das gilt umso mehr als sich der stärkste Gegenwind der letzten Jahrzehnte zunemhemnd in einen angenehmen Rückenwind zu wandeln scheint ( siehe Central Banks Net Buyers Of Gold....... )

WHAT IT IS ABOUT GOLD?

After all, you can’t calculate a P/E. There is no dividend discount model. There is no interest rate or income stream. No — gold is a store of value and one that has been durable and reliable for thousands of years. No fiat currency system has outlived gold. The question is what is so sacred about fiat paper money? A backing of the government printing press, is that the alluring factor? The Fed has been pumping money into the system at an unprecedented fashion and even if it is sitting idle on commercial bank balance sheets as excess reserves, that money is still in the system.

So what about gold? How much of that is in the system? How about the fact that global gold production, after doubling from 1980 to 1999, has completely stagnated over the past decade? Has fiat currency done that? And, how long does it normally take for a gold mine to yield production? Answer -- five years or so? Do you think it takes Bernanke et al that long to print greenbacks? At least we know with some degree of confidence about the supply of gold; there are reserves equivalent to about 40% of the total amount of gold above the ground (and half of that is in South Africa).

As we said, it takes time, usually five years, and plenty of financial resources to bring gold mines into production. In this sense the supply side of the gold equation is relatively constant — in economic parlance. Fiat government-issued currency is not — especially in the context of a U.S. monetary and fiscal authority that will stop at nothing to revive a cycle of overspending and overborrowing.

In the current sense, the pullback in consumer spending is being replaced either by government spending or incentives to prevent households from modifying their spending behaviour away from frugality; and the pullback in credit demand by the consumer sector is being offset by the Fed’s involvement in the mortgage market to ensure that borrowing costs remain very low, and by the FHA to ensure that down-payment requirements are as close to zero as possible. The supply of gold is reasonably easy to figure out — the supply of fiat currency is less easy to figure out. The behaviour of not just the U.S. government but governments everywhere seems to be that reflationary policies will ultimately be the key towards redressing the ongoing private sector deleveraging cycle.

Back to the gold market. There is an estimated 120,000-140,000 tons of gold above ground. That would equate to roughly $4 trillion. The total amount of U.S. dollars in circulation globally is estimated at $8 trillion, and the total size of the global money supply would thereby be closer to $30 trillion. The size of the world stock market is around $40 trillion. At last count, the total size of the global bond market was north of $80 trillion. The total world derivatives market has been estimated at about $800 trillion, face or nominal value. Hopefully all this places the total value of gold above ground into a certain perspective.
So, here is what makes gold so attractive, beyond the fact that it is a hedge against irresponsible fiscal, monetary policies and reckless trade policies, is that relative to fiat currency, bonds and equities, it is scarce.
We can also get into geopolitical uncertainties and reckless trade policies, but they are just the proverbial cherry on the ice cream.
Scarcity. That is the answer to the question “why gold?” End of story.

Just to back the amount of currency that is out there right now, gold has the potential to triple from here, never mind merely double. Sounds outlandish, to be sure, but when gold was carving out its bottom at $255/oz in September 1999 (when the S&P 500 was flirting near 1,300 — sorry to have to add that one in), was anyone calling for it to rise four-fold in the next decade? Secular bull markets usually last 16 to 18 years and this one is just in year 10, so let’s say that we are barely past the halfway point in both duration and magnitude in this gold cycle

Paul Tudor Jones ♥ gold FT Alphaville

By our estimation, G7 central banks have upwards of 35% of total reserve
assets in gold. However, the remaining countries that make up the G20 only have 3.5% of their reserve assets in gold. These countries have seen a $2.2 trillion increase in reserve assets over the last five years, making up well over 50% of the increase in global reserves. However, despite a 150% increase in the price of gold, 97% of the increase in reserve assets has been in the form of paper currency or interest-bearing notes backed by paper currency.

> I also urge everybody still not convinced that at least a small part of their portfolio should include GOLD to read the following report........

> Der nachfolgende Report verdeutlicht mehr als eindrucksvoll warum meiner Meinung nach in jedes Depot GOLD zumindest einen gewissen Prozentsatz enthalten sollte.....

Sprott Oct 2009 Comment


H/T ZH

Labels: , , , , , , , ,

Wednesday, October 14, 2009

Speaking Of A Money Illusion........

As assumed last Friday the Dow finally hit 10 K. After looking at the chart you probably know why i prefer gold....... I think a few years from now this ratio will be even more favourable.....Wouldn´t surprise me if we see similar ratios like in 1980 . The same is true when you price the S&P 500 in Gold .....

Wie bereits letzten Freitag hat der Dow die 10 K geknackt. Habe das mal zum Anlaß genommen das Dow/Gold upzudaten. Unschwer zu erkennen warum ich seit langer Zeit Gold bevorzuge.... Meiner Meinung nach wird sich dieses Verhältnis zukünftig noch weiter zugunsten von Gold beschleunigen.... Ich würde selbst ein Verhältnis ähnlich dem Jahr 1980 für nicht "unwahrscheinlich" halten. Ähnlich verhält es sich wenn man den S&P 500 in Gold kalkuliert .....

Theodore Weisberg wears a had reading DOW 10,000 after the close of trading on the floor of the New York Stock Exchange in New York.

WSJ

And you thought you had broken even. If investors had bought gold when the Dow first closed above 10000 in March 1999, they'd be up almost 280%.

Put another way, Dow 10000 a decade ago "cost" 36 ounces of gold, treating each Dow point as $1.

When the Dow revisited that level Wednesday, it was worth only 9.276 ounces of gold.

In oil terms, the Dow has gone from 609 barrels to 133.

Chart via Zero Hedge

bigger / größer

Dow 10,000: A Celebration Jesse

Team coverage today on Bloomberg by the Money Honeys as the Dow Jones Industrial Average crossed 10,000 intra-day, led by J.P. Morgan, in a move that surely epitomizes the illusions of wealth granted by modern accounting practices.

Can you believe the NYSE had the nerve to prepare new Dow 10,000 hats and distribute them for today? The first time the Dow Industrials crossed 10,000 was in 1999. The last time it closed over 10,000 was in October of 2008, just
before the most recent plunge of the collapsing credit bubble.

That does not speak well of equities for the "buy and hold" crowd, which has surely had a wild ride if they have indeed managed to hold on for the last ten years, and ex-dividends and fees and commissions and inflation and a plunging US dollar and soaring commodities are... even.
AMEN :-)

UPDATE:

The following videos are too good to be buried in the comment section..... Judging from this interview Bloomberg has morphed into another version of CNBC.......

Denke die folgenden Clips sind zu gut um in den Kommentaren versteckt zu werden..... Muß gestehen das ich nach dem folgenden Interview den Eindruck habe das sich Blommberg und CNBC nicht mehr wesentlich voneinander unterscheiden......


The Colbert ReportMon - Thurs 11:30pm / 10:30c
The Money Shot
http://www.colbertnation.com/
Colbert Report Full EpisodesPolitical HumorMichael Moore


The Daily Show With Jon StewartMon - Thurs 11p / 10c
Dow Jones Rebounds to 1999
http://www.thedailyshow.com/
Daily Show
Full Episodes
Political HumorRon Paul Interview


Labels: , , , , , , , , , ,

Friday, October 09, 2009

Thank God There Is No Conflict Of Interest....... ;-)

Nothing really new but with the Dow probably hitting 10.000 on Monday i think it´s not a bad time to update the topic "Wall Street Finest" ....... Watch the red line......

Da der Dow wahrscheinlich am Montag die 10.000 knacken wird und auch ansonsten alle Märkte weltweit nahe Ihren Hochs stehen kann es nicht schaden erneut einen Blick die selbstverständlich "höchst wertvolle" Rolle der sog. Experten , oder wie von mir liebevoll als"Wall Street Finest" tituliert, zu werfen..... Man beachte die rote Linie....


‘Sell’ for Research Renegades Becomes Business Off Wall Street
Bloomberg

In October 2008, as the global financial system teetered on the brink of collapse, “sell” calls in U.S. markets constituted 6 percent of the total recommendations by analysts, with “buys” comprising 36 percent and “holds,” 58 percent, according to Bloomberg data.
Almost a year later, amid a stock market rally, the percentage of “buy” calls dropped: They made up 32 percent, with “holds” comprising 63 percent and “sells,” 5 percent, as of Oct. 8.

"Business as usual" ( across all segments ).....Now compare this kind of "wisdom" with the next report on valuations......

"Business As Usual" ( und das über alle Sektoren) ..... Vergleicht bitte die o.g. "Weisheit" mit dem folgenden Report zum Thema Bewertungen......

Special Report Valuation 100909


Mish

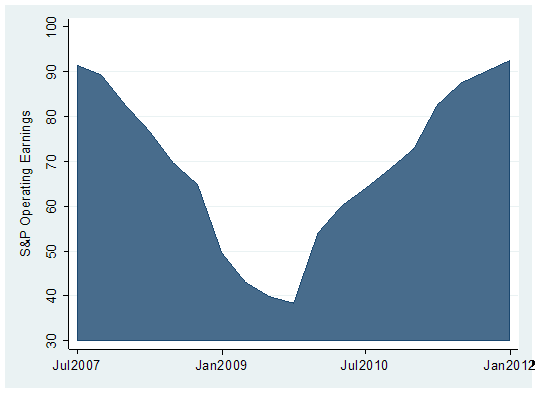
Even if one uses "operating earnings" a euphemism for "blatant lie" in which all "one-time losses" that recur like clockwork are ignored (along with everything else the companies want to ignore), the PE based clocks in at 29.64 as of the end of the third quarter according to S&P Earnings Data.

Forward Earnings Imply a Return To Near-Record Profit Margins Hester/Hussman

At these levels it seems that a full-blown V-shaped recovery is being priced in. There's no better example of a V-shaped forecast than for what is expected for the recovery in earnings over the next couple of years. The graph below shows the operating profit series, which includes actual results from the second quarter of 2007 – when earnings peaked – through this year's second quarter, and then continues with estimates through the end of 2011.

For operating earnings to get back to their peak levels, analysts have penciled in earnings growth of more than 40 percent over the next year, and then another 22 percent between 2010 and 2011

What is worth highlighting is that analysts expect that the typical company will soon achieve the same level of profit margin that they were able to deliver in the years leading up to 2007 – a period where leverage was preferred over balance sheet strength, a preference by company managements to focus on equity shareholders, during a political climate where labor lacked bargaining power, where consumer spending was fueled by mortgage equity withdrawals, and leverage ratios increased broadly because business and consumer credit was easy to come by.

To assume a return to peak profit margins is a bet that the economic and political landscape that emerges over the next year or two will match the pre-panic landscape perfectly.

But it is also important to keep this from Barry Ritholtz & Hester in mind......

In jedem Fall sollte man aber diesen Kernsatz von Barry Ritholtz & Hester im Hinterkopf haben.....

Barry: As noted previously, at times, things like “valuation” or the economy or earnings don’t matter — until they suddenly do.

Hester : While S&P earnings may not be able to rise to the lofty expectations of analysts over the next couple of years, this isn't a strongly bearish argument in itself. The link between near-term earnings and stock direction is tenuous. Outside of very large changes in earnings, there is essentially no correlation between year-over-year changes in earnings and changes in stock prices.

But if you're investor that is sensitive to valuation and your preference is to use forward earnings, then an understanding of the building blocks that create those earnings estimates is important.

Regardless of this rule the risk/reward ratio isn´t quite "favourable" ( i´m being polite ) right now...... But as long as the technicals are not breaking down it is still too dangerous to entry a short position...... Even if it is very tempting.... ;-) At least the first not insignificant signs are popping up that the party might be over rather sooner than later......At some point this kind of "wealth transfer" has to stop...... I´m pretty sure this guy will have lots of fun in 2010...... ;-)

Denke es bleibt in jedem Fall festzuhalten das das momentan vorhandene Chance/Risikoverhältnis nicht gerade vorteilhaft ( höflich vormuliert ) ist...... Solange die Markttechnik aber noch intakt ist sollte man auf jeden Fall der Versuchung widerstehen short zu gehen. Auch wenn das tagtäglich schwerer fällt...... ;-) Immerhin sind doch erste ernsthafte Anzeichen zu erkennen die andeuten das der Party bald der Treibstoff ausgeht.......Spätestens wenn diese Art von "Umverteilung notgedrungen Ihr Ende findet......Ich bin mir ziemlich sicher das dieser Typ spätestens im Jahr 2010 eine Menge Spaß haben wird...... ;-)

Labels: , , , , , , ,

Tuesday, October 06, 2009

Kyle Bass & David Rosenberg

Probably no coincidence that two of the brightest like GOLD ( both with different views if & when inflation will become a problem )........... Excellent read!

Sicher kein Zufall das zwei der Besten Gold nicht abgeneigt entgegen stehen. Und das obwohl die Zwei weit ( Untertreibung ) auseinander liegen ob & wann Inflation problematisch werden könnte..... Extrem empfehlenswert! Klickt bitte jeweils den Toggle Button oben rechts und nutzt dann die Zoomfunktion für das perfekte Format.

H/T Zero Hedge

"The man who made billions shorting subprime shares his latest observations."
Hay Man


H/T Expected Returns

" One of the few economists living in the real world."

Lunch With Dave 100209


Here are his thoughts on today´s rally. For a daily dose of excellent "ANTI SPIN" i highly recommend to subsribe to the free daily update from David Rosenberg.

Hier seine Gedanken zum heutigen Kursfeuerwerk. Wer die momentan wohl beste tagtägliche Analyse frei aus geliefert haben möchte der sollte sich hier registrieren lassen.

Labels: , ,

Sunday, September 20, 2009

Where Is The Volume......?

Some very interesting charts & observations from William Hester. As i´ve written earlier i´m very sceptical ( quite an understatement ) regarding the health of the recent market rally..... I´ve added the latest from Rosenberg via Zero Hedge & another Chart via WSJ

Einige sehr aufschlußreiche Charts & Bemerkungen von William Hester. Wie bereits früher geschrieben bin ich extrem skeptisch ( leichte Untertreibung ) was die Verfassung der Märkte angeht. Ich habe zusätzlich noch was vom Rosenberg ( via Zero Hedge ) sowie dem WSJ hinzugefügt.

A Bear Market Lurks as Dow Nears 10000 WSJ

[bear markets and stocks]

Rosie On Who The Market Buyers Are From this morning's Breakfast With Dave:

Is it the private client? Not really — stock funds actually had net outflows of $1.33 billion last week, while bond funds enjoyed an $8.2 billion net inflow.

Is it corporate insiders? Well, heck no — Robert Toll (CEO of Toll Brothers) just disclosed that he sold a total 1.6 million shares of his company’s stock yesterday.

UPDATE via Hulbert: They are selling a whole lot more of their companies' stock than they are buying. The net difference is even larger than it was two months ago, when I noted that insiders were already selling at a greater pace than at any time since the top of the bull market in the fall of 2007

For the week ended last Friday, according to Vickers, insiders sold 6.31 shares for every one than they bought. The comparable ratio two months ago was 4.16-to-1, and at the March lows the ratio was 0.34-to-1.

Is it buybacks? Not at all — in fact, S&P 500 companies bought back a mere $24.4 billion on stock repurchases in 2Q, down 72% from a year ago and the lowest in recorded history, according to Howard Silverblatt of Standard & Poor’s. ( great Chart via Floyd Norris )

So who’s doing the buying? Very likely it is still a combination of program trading, short coverings and portfolio managers desperately trying to make up for last year’s epic losses.

Without Phoenix Stocks, Volume Continues to Contract Wiliam Hester / Hussman

The most notable characteristic of a durable stock-market advance, which failed to appear in the recent advance, is a strong expansion of trading volume. When you adjust the trading volume data for a handful of mostly lower-quality financial stocks, the picture gets worse.
I noted in Trading Volume Separates Bull Markets from Bear Rallies that bull markets have typically begun on strong volume after selling had become exhausted. As Richard Russell has said - “volume should always be studied as a trend relative to what has preceded it”. The chart below updates one of the graphs for the elapsed time from that earlier piece. The vertical axis measures the six-month percent change in the S&P 500 from the bottom of each bear market going back to the early 1940's. The horizontal axis shows the percent change in volume over that same period.
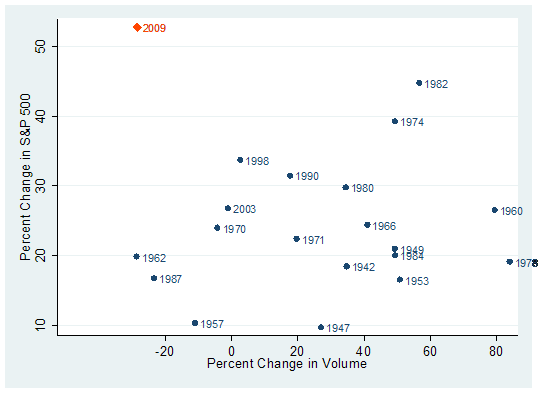

Familiar durable bear-market bottoms stand out, like in 1982 and 1974. These rallies had strong returns that coincided with large bursts of trading volume during the first six months of the rally. There are a couple of examples, like 1998 and 2003, where bull markets had a good start on mediocre expansions in volume. But for the most part, in the cases where volume contracted the bull market beginnings have been uninspiring. More common is a strong increase in volume that coincides with gains of 20 to 25 percent during the first six months.

It's clear that this year's rally is an extreme outlier in the dataset, with above-average returns and a continued contraction in volume from the levels of trading in March.
Even so, some analysts have become optimistic because volume trends first leveled off, and then have risen marginally over the last few weeks.

But almost the entire rise in volume during the last month and half has come from a handful of stocks. Examples include Fannie Mae, Freddie Mac, Citigroup, AIG, and Bank of America
These are just five. There are a couple of other stocks that are interchangeable with these companies and would produce similar results – but the characteristic they all share is that they are financial stocks that only recently were on the brink of collapse. And since the Government's rescue of these and other financial firms, the group has risen up from the ashes. For ease of reference, we'll call these Phoenix stocks.
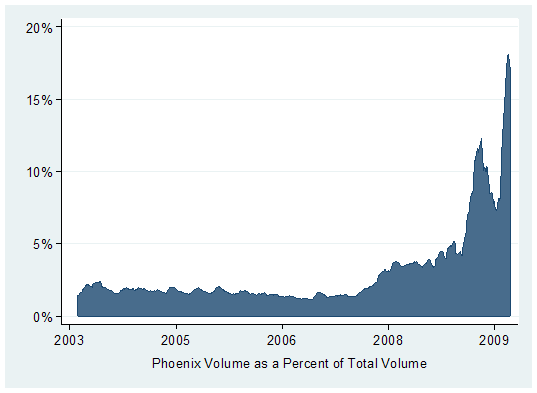


The rise in trading volumes in some of these stocks has been considerable. The shares of AIG now often trade with 15 times the volume they traded a year ago. Citigroup has traded at 12 times the amount from a year ago. This helps explain why the trades in these companies' shares are taking up a larger fraction of total share volume. The graph below shows the trading volume in the Phoenix stocks as a percent of total NYSE share volume since 2003. You can see that the trend of rising volumes in relation to total volume began during 2008, when volumes rose as the market capitalizations of these companies shares fell. Off of this year's March low, Phoenix volumes as a percent of total volume rose above 5 percent for the first time and then fell off slightly in June and July.

During the last six weeks, the trading in these stocks as a percent of total volume has jumped to almost of fifth of share trading.
Commentators and analysts have offered up a few explanations for the heavy trading in these shares – short covering, the focus of day traders, and institutional trend following programs. Each of those explanations is probably doing their part. Outside of highlighting the casino-like atmosphere that has gripped parts of the stock market, the amount of trading in these shares is less important than the role this trading is playing in the overall volume figures.

The graph below shows two measures of trading volume. The blue line is the daily share volume traded on the NYSE (smoothed). The red line is total volume less the volume traded in our group of Phoenix stocks. As the graph shows, during the last couple of years, the two lines have hardly parted. That's because the Phoenix trading volume was a small fraction of total volume. The recent divergence between the two highlights that volume outside of a handful of these financial stocks continues to contract.
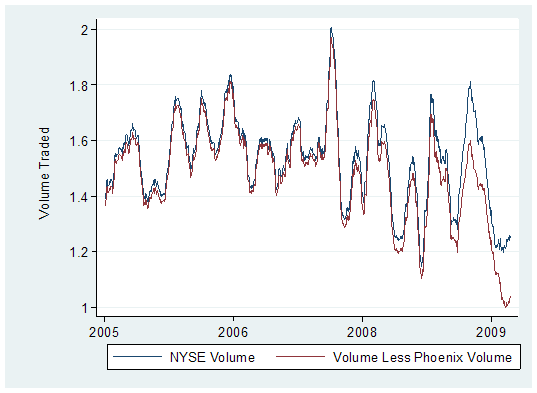


On a Phoenix-volume adjusted basis, NYSE share trading is at the lowest level in years. Healthy bull markets, even if not during the earliest days of a rally, will typically recruit growing amounts of investor interest and expanding levels of volume as prices rise
Expanding volume continues to be an important characteristic missing from this rally.

Update:

I think balance sheets and sustainability - govt, central bank AND private sector, MATTER Bob, ‘The Bear’, Janjuah via FT Alphaville

If they no longer matter, I will be WRONG, and I will have to accept that the policy of ‘Print/Borrow/Spend on Rubbish we don’t Need’ is a limitless phenomena, without consequences, which means there should never be a bear market ever again….

I hope this sounds as ridiculous to you reading as it did to me when writing…..

This quote was just too good to be burried in the comment section...... ;-)

Dieses Zitat war einfach zu gut um es lediglich in den Comments zu posten.. ;-)

Labels: , , , , , , , , ,

Tuesday, August 11, 2009

Putting The Rally Into Perspective......A Record Bounce?

This is a follow up on my earlier posts But Still Better Than Expected........ & More On "The Less Bad Is Good" Mantra....... & Chart Of the Day "Today´s Rally vs Rally 1929/1930"

Wenn man so möchte ist dieses Posting ein Nachschlag zu meinen früheren Beiträgen But Still Better Than Expected........ & More On "The Less Bad Is Good" Mantra....... & Chart Of the Day "Today´s Rally vs Rally 1929/1930"


A RECORD BOUNCE? David Rosenberg

The S&P 500 has rebounded 49% from those March 9 lows. Imagine how abnormal a 49% rally over a five-month span is — it’s unprecedented back to the 1930s. In the last cycle, it didn’t happen until February 2004 — 18 months into that bull phase where again there was tremendous policy stimulus and an oversold low to climb out of.

In addition, household credit was expanding rapidly. Even coming into what was a secular bull market in 1982, it took a good seven months to rally 49%, and that was with the benefit of a V-shaped economic recovery.

Going back to 1950, it has taken an average of around 18 months for the market to rebound 49% from a recession trough, not five months as has been the case thus far.

Let’s examine what the macro landscape usually looks like at that magical +49% point in the equity market rally:

• Real GDP had expanded on average by 4.5%
• Employment rebounded an average of 850k
• The ISM manufacturing index had firmed to an average of 56.2 (the lowest print by this juncture was 53.9)
• Corporate profits had recovered 12%
• Bank lending rose an average of 5%

In other words, the market is way ahead of itself, because, as of the latest data points during this 49% rally:

• Real GDP is trying to make a cycle low
• Employment is trying to make a cycle low
• The ISM is off the low but still sub-50, at 48.9
• Corporate profits are still trying to make a cycle low
• Bank lending is still trying to make a cycle low

We have never before witnessed a stock market rally of this magnitude over such a short time frame and absent anything more than tentative signs of economic improvement.

The only rally of this magnitude was the wild bear market rally ride in 1930, which was followed by a resumption of the decline that finally bottomed 82% lower in 1932.

A VERY SPECULATIVE STOCK MARKET
This is the most speculative momentum-driven equity market since the early 1930s. Make no mistake, the economy is getting better but most of the diffusion indices are still below the 50 cutoff and many of the economic indicators are still in negative growth terrain

But what we have on our hands is a jobless, revenue-less, income-less, profitless and consumer-less recovery. It’s a one of a kind.

The equity market tends to bottom 3-6 months before the recession ends; normally it is four months. The S&P 500 bottomed in March, and we are now four months into this rally and while the media have declared the recession to have ended, none of the four classic ingredients that go into making that call have yet to bottom.

Hence, Mr. Market may well be way ahead of himself on this one. No doubt that the market was priced for extremely bad news at those March lows, but let’s face it, the news turned out to be pretty bad, especially for those 2.2 million people who lost their jobs since that time. That’s more than the entire March 2001-June 2003 down-cycle — in just five months.

> Just today three major German financial newspapers ( FT Germany, Handelsblatt und Welt ) had all bullish stories why stocks have room to climb higher.....At least they didn´t have their stories on the cover.... This would have triggered a perfect signal to short the market....;-) The FAZ seems to be regular readers of Zero Hedge and is therefore less "euphoric"......You really have to be brave to be long this market....... The risk/reward isn´t quite "balanced" right now......

> Im Vergleich ( DAX 5400 ) dazu die heutigen Artikel der FT ( siehe Acht Gründe, warum es weiter aufwärts gehen könnte. ) , der Welt ( siehe Die Börse beweist, dass die Krise bald vorbei ist) & des Handelsblattes ( siehe Charttechnik verspricht steigende Kurse ) Immerhin haben es die Beiträge nicht auf die Titelseiten geschafft...... Ansonsten wäre heute sicher der ideale Tag um short gehen..... :-) Lediglich die FAZ ( siehe Ohne Umsatzzuwachs keine Gewinnsteigerungen ) ist nicht ganz so euphorisch. Sieht so aus als wenn einige in der FAZ Zero Hedge Fans sind....... Ich bin mehr denn je der Meinung das wirklich nur ganz Wagemutige long sein sollten....Das Chance/Risikoprofil ist "ÜBELST"........

Labels: , ,

Wednesday, August 05, 2009

Chart Of the Day "Today´s Rally vs Rally 1929/1930"

For a daily dose of excellent "ANTI SPIN" i highly recommend to subsribe to the free daily update from David Rosenberg.

Wer die momentan wohl beste tagtägliche Analyse frei Haus geliefert haben möchte der sollte sich hier registrieren lassen. David Rosenberg unterscheided sich nicht erst seit seinem Wechsel von Merrill Lynch zu Gluskin Sheff wohltuend von den üblichen Verdächtigen....

H/T Clusterstock

1929 comparison

This is from another Rosenberg piece via Mish
Rosenberg also points out that the 46% rally in 101 days is unmatched dating back to 1933. I suppose the rally could continue given the 1933 rally lasted 249 days taking the stock market up 172%. However, I would not recommend playing for it.
> Be careful if you´re still long this market...... The risk/reward ratio isn´t quite "favourable" right now..... If you´re considering to short this market i agree with Jesse ( even if it is very tempting) .....

> Denke man sollte sehr vorsichtig sein wenn man noch immer long ist...... Für meinen Geschmack ist das Chance/Risikoverhältnis wenig vorteilhaft und wie ich finde stand es sogar selten schlechter als dies momentan der Fall ist ..... Für alle die mit dem Gedanken spielen short zu gehen empfehle ich den regelmäßigen Besuch der Seite von Jesse.....


UPDATE:

More realistic stuff from Rosenberg What Growth is the S&P 500 Pricing In? via Mish including the not so unrealistic chart 3 Stages Of A Bear Market .

Passend zum unten genannten Clip der nachfolgende Link von RosenbergWhat Growth is the S&P 500 Pricing In? via Mish der einen wie ich finde nicht unwahrscheinlichen Marktverlauf ( siehe 3 Stages Of A Bear Market ) beschreibt....


Mish sums it up....
Rosenberg suggests there will be no recovery without the consumer. I suggest there will be no recovery in consumer spending, discounting of course "free money" programs like "cash for clunkers".

Of course this all depends on the definition of "recovery". At best, I think we have a "Recoveryless Recovery" before the economy slips back into a double or triple dip recession. Regardless, the stock market is priced for perfection while the odds of perfection are close to zero.
I agree.... Especially when you add charts like Zero 10 Year US Job Creation to the mix.....

Hätte es besser nicht formulieren können.....Gilt besonders dann wennn man sich folgenden Chart ( siehe Zero 10 Year US Job Creation ) vor Augen führt....

Labels: , ,

Sunday, December 17, 2006

"this expansion is getting old"

this is from ""year of transition". the 2007 outlook from rosenberg/merrill lynch. please click on the headline to get to bill cara´s site for more.

das is ein auszug aud dem werk von rosenberg/merrill lynch für das jahr 2007. bitte auf die überschrift klicken um auf die seite von bill cara zu gehen um den rest zu lesen.

thanks/danke an bill cara


größer/bigger http://www.billcara.com/001o004.gif

Labels: , ,