Hussman & Hester vs Wall Street Finest.......
There maybe are legitimate reasons to buy stocks, but a favourable opinion from "Wall Street Finest" should definitely not play any role among your screening process .... Except you use them as a "contrary indicator".... ;-)Einmal mehr deutliche Worte vom ansonsten doch recht zurückhaltenden Hussman....Eine erstklassige Ergänzung zu meinem früheren Posting Of Course It Is Still A Good Time To Buy, Buy, Buy.....
Grundsätzlich mag es ja durchaus gute Gründe die für Aktien sprechen geben, man sollte aber sicherstellen das die Einschätzungen der "Experten" beim Auswahlprozess keinerlei Rolle spielen....Es sei denn man nutzt sie als Kontraindikator.... ;-)
Misallocating resources John Hussman
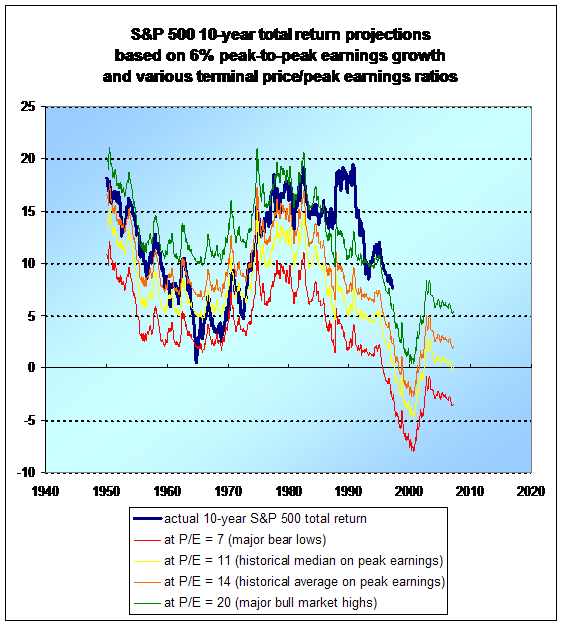
On a valuation basis, the S&P 500 remains about 40% above historical norms on the basis of normalized earnings. The disparity between our valuation assessment and the putative undervaluation being touted by Wall Street analysts is so great that a few remarks are in order. First, virtually every assessment that "stocks are cheap" here is based on the ratio of the S&P 500 to year-ahead operating earnings estimates, and often comes with a comparison of the resulting "earnings yield" with the depressed 10-year Treasury yield. What's fascinating about this is that this is the same basis on which analysts deemed stocks to be about 40% undervalued just prior to the 2007 top, following which the market plunged by more than half.More on this topic in "Reported Earnings vs Operating Earnings"
To properly understand the price-to-forward operating earnings ratio, you have to recognize that operating earnings exclude a whole host of charges - what some observers correctly call "recurring non-recurring" charges. These include large and often quite regular losses that the companies deem, often on the thinnest basis, to be detached from their core business - even if the losses are directly related to their core business.
Mehr zum Thema in "Reported Earnings vs Operating Earnings"
Wall Street Earnings Expectations Ignore Economic Divergences Bill Hester / Hussman FundsWhen you hear analysts say that the historical average P/E ratio is about 15, you have to recognize that this is the normal P/E based on trailing 12-month earnings after subtracting all writeoffs and other charges. Forward operating earnings are invariably much higher, and it turns out that the comparable historical norm, as I discuss in that 2007 piece, is only about 12. If you exclude the late 1990's bubble valuations, you get a historical norm closer to 11.5. The 1982 and 1974 market lows occurred at about 6 times estimated forward operating earnings
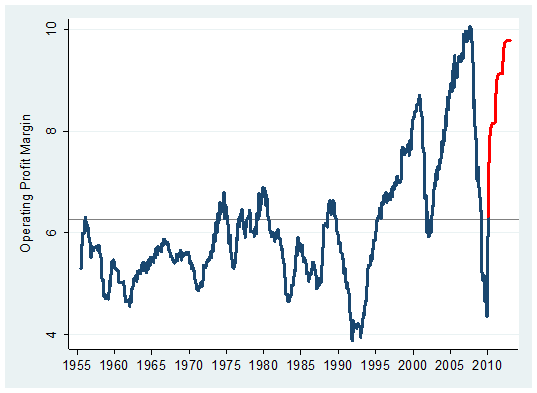
A final observation is crucial. Current forward operating earnings estimates assume profit margins for the S&P 500 companies that are nearly 50% above their long-term historical norms. While we did observe such profit margins for a brief shining moment in 2007, profit margins are extraordinarily cyclical. Investors will walk themselves over a cliff if they price stocks as if profit margins, going forward, will be dramatically and sustainably higher than U.S. companies achieved in all of market history.
They also ignore the large percentage of reported earnings that are actually quietly distributed to corporate insiders through the issuance of stock and options.They blindly accept that "share repurchases" are somehow a pleasant distribution of earnings, whereas the majority of share repurchases are actually made by companies to do nothing more than offset the dilution from stock shares and options granted to insiders.
A good question to ask in the years ahead, immediately after profits are reported, is "how much of this figure is actually delivered to shareholders?" If you've been attentive over the past decade, the answer turns out to be much closer to the dividend yield than to the operating earnings yield that companies have reported.
For a moment, at least, it is good to be a corporate insider, particularly at major financial companies.First, you get to report productivity gains and "operating profits" - not by making smart investments in productive assets, but instead by writing up debt thanks to Treasury intervention, by misstating your balance sheet thanks to FASB changes last year, and at industrial firms, by cutting the number of workers per unit of capital.
Next, you quietly write off large losses on bad investments and unrecoverable loans as "extraordinary expenses," to which investors pay no notice.
And to add insult to injury, you deliver a significant portion of the remaining profits to yourself as "incentive compensation," followed by buybacks of stock to offset the dilution, which investors actually cheer because they don't realize they've been taken for suckers.
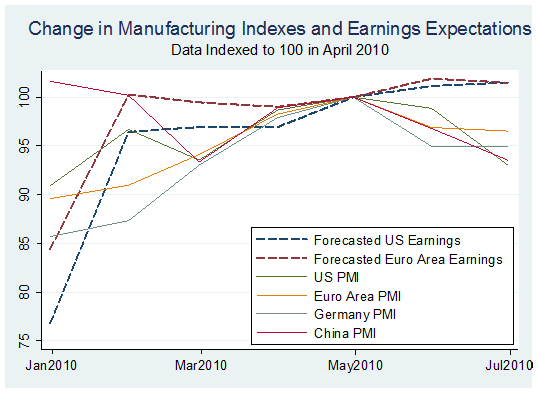
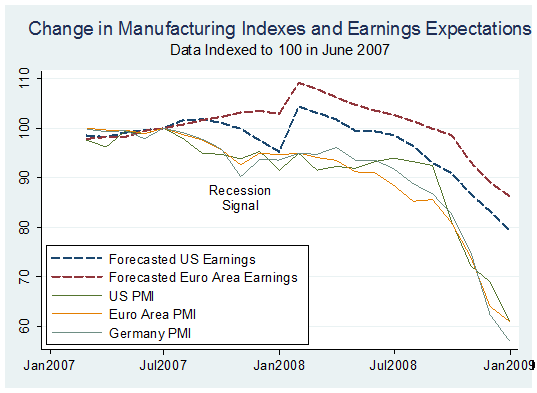
Now take a look at the Chart showing the period between 2007 and 2008 using the same indices.... I highly recommend to read the entire links.... There is much more.....The graph below attempts to contrast the erosion in the global PMI indexes against the rising optimism of stock analysts.
Six series of data are plotted: the changes in earnings expected for the companies in the S&P 500 and the Euro Stoxx Index, and four PMI indexes for the US, the Euro area, Germany, and China. Each of the series is indexed to 100 in April, the month where most of the PMI data peaked.
Hier zum Vergleich der identische Chart für die Zeit von 2007 bis 2008...... Empfehle die kompletten Links zu lesen... Wie üblich findet man dort noch deutlich mehr "Anti Spin"......
UPDATE:
RARE INTERVIEW WITH JOHN HUSSMAN: WHY HE IS BEARISH RIGHT NOW PragCap
Stocks Expected To See 12% Increase In Revenues In Q2, 41% Increase In EPS, And A Summary Outlook From Rosenberg ZH
As for all of 2010, the consensus is at $82 operating EPS, and for a new record to be reached in 2011, at $96 — breaking the record of $88 three years ago. Good luck in seeing a further 30% increase in profits with nominal GDP rising at a 3.0-4.0% annual rate at best in the next six quarters and at a time when margins are already back to cycle peaks.For the full John Hussman archive visit the blogroll.....
Für eine komplette Auflistung der gesammelten Werke von Joghn Hussman bitte Blogroll beachten.....
Labels: anti spin, earnings quality, hester, hussman, profit margins, wall street finest
posted by jmf at 10:20 PM
0 comments




 Ökonomen geben allerdings zu bedenken, dass viele Firmen ihre relativen Gewinne mit milliardenschweren Aktienrückkäufen aufpolieren. Thomson Financial geht davon aus, dass die Unternehmen inzwischen 23 Prozent ihres Ertragswachstums allein diesen aktionärsfreundlichen Programmen verdanken. Durch den Rückkauf eigener Aktien sinkt die Zahl der außen stehenden Papiere. Dadurch erhöht sich automatisch der Gewinn je Akti.. "Es ist offensichtlich, dass der Einfluss von Rückkaufprogrammen größer wird", sagte Thomson-Direktor Michael Thompson dem Handelsblatt.

 Some people try to spin the recent M&A number and point out that the average premium paid is stilll far below the peak in 1999 and implying that there is still more to come. Sounds desperate to me. As i´ve written above AOL and others have paid with almost worthless paper/stocks. I can remember a deal from JSDU that bought SDLI with a huge premium for over $35 billion. No wonder that premiums were high......
 Here comes the real story! This graph show the purchase price (including debt) on a cash flow basis (ebitda). This parameter is hitting new historic highs! The fact that at the same time margins are also at all time highs makes this number even more worrysome.....We will see down the road how many of the recent deals were/are "smart" deals. But one thing is for sure....the deals are not cheap!
 kann diese einschätzung nur bestätigen. in nahezu jedem call oder veröffentlichung hat das management versucht schlechte ergebnisse durch massive (ofte auf pump) aktienrückkäufe zu verschleiern. etliche von denen sind keine 3 bis 6 monate später in großen problemen oder gar pleite. die betrachtung der s&p statistik macht das ganze nicht gerade gemütlicher.....ausserdem verkauft das management in gleicher zeit in rekordtempo eigene aktien/optionen.....besonders bedenklich wird es wenn das management auf pump aktien zurückkauft und dadurch sogar die unmittelbare herunterstufung de kreditwürdigkeit achselzuckend in kauf nimmt.
 The biggest buyer is the corporate sector itself. According to Tim Bond, of Barclays Capital, American companies acquired (via takeovers and buy-backs) some $602 billion of shares last year. In the fourth quarter, the pace of purchases was running at an annualised rate of 6% of the entire market. April 23rd was the biggest day for takeover announcements since the AOL/Time Warner deal of January 2000 and the following day saw IBM announce a $15 billion buy-back. With that kind of support, it is hardly surprising that investors can shrug off economic and geopolitical concerns and push the Dow Jones industrials to a new record above 13,000, as they did on April 25th.

 Despite good results so far, HSBC says forecasts for 2007 earnings per share for S&P 500 companies have edged down from $95 in the middle of last year to less than $93 today. And Dave Rosenberg, a Merrill Lynch economist, says that, over the past six months, business sales have fallen at an annual rate of 2.3%.



![[Most Recent Quotes from www.kitco.com]](http://www.kitconet.com/charts/metals/gold/t24_au_en_usoz_2.gif)
![[Most Recent Quotes from www.kitco.com]](http://www.kitconet.com/charts/metals/gold/t24_au_en_euoz_2.gif)