Monday, April 05, 2010

Profit Margins, Margin Debt & Margin Of Error.......

Combine the data points with the excellent When Risk-Return Makes No Sense: How To Deal With An Overvalued Market and it should be clear that Mr. Market is walking on very thin ice now... I must admit that this is my view since September/October......Cannot help but it at least smells a little bit like "Flucht In Sachwerte"... I still think that the risk / reward is far more favourable in GOLD... ;-)

Wenn man die folgenden Daten mit dem extrem lesenswerten When Risk-Return Makes No Sense: How To Deal With An Overvalued Market kombiniert wird klar das man sich momentan auf sehr dünnem Eis bewegt.... Muß gestehen das ich diese Ansicht seit dem September/Oktober vertrete.... So langsam kann man zumindest unterschwellig das Gefühl haben das zumindest in Teilen eine "Flucht In Sachwerte" eingesetzt hat.....Bin mehr denn je überzeugt das in Sachen Chance/Risiko die Aussichten für GOLD weitaus vielversprechender sind.... ;-)
William Hester / Hussman Funds
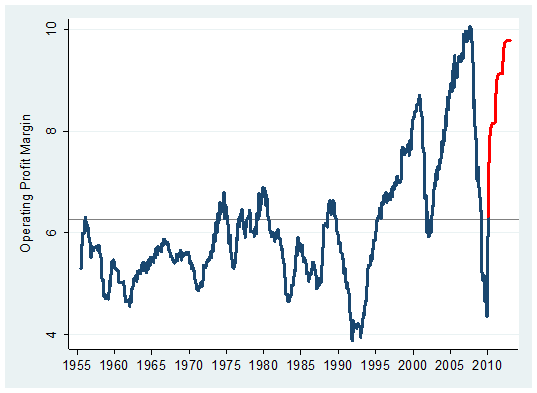
While earnings growth expectations are steep, sales growth expectations are more modest. Sales-per-share for S&P 500 companies is expected to grow about 5.5 percent this year and about 7 percent next year, according to forecasts. The difference between the growth rates of the top and bottom lines is implies a forecast for sharply rising operating profit margins. The graph below is updated from an earlier piece, and includes forecasts through the end of 2012. It plots the long-term level of S&P operating margins in blue. In red, I've plotted the operating margins currently being forecasted by analysts based on their projections for sales and earnings. Last October, analysts were about half way to pricing in profit margins that matched the record levels of 2007. Now, they are just about there.
David Rosenberg / Gluskin Sheff
As for 2011, the consensus is looking for $97 on S&P 500 operating EPS — we did $95 at the peak of the last cycle when the unemployment rate was at 4.5%, the industry CAPU rate was 81%, private sector credit xpanding at a 16.2% annual rate and nominal GDP at a 4.9% YoY pace.
So the consensus believes that barely two years into the second weakest post-recession recovery in the past six decades that we will actually get back to peak profit levels seems to be a tad outlandish.
Stock Market Rally Explained The Mess That Greenspan Made

Ad in the the Money & Investing section of today’s Wall Street Journal

Factoring in the tight junk spreads right now one must assume that looking at the next chart the "Margin Of Error" is probably "slim"......

Da momentan selbst historisch gesehen recht enge Junk Spreads vorherrschen muß man beim Anblick des nächsten Charts wohl unterstellen das in Sachen "Margin Of Error" wenig "Spielraum" bleibt.....

Investors really ♥ junk. We mean really. FT Alphaville

In most discussions of the high-yield bond market, historical spreads play a major role. But comparing spreads today to those of the past assumes that junk bonds are a constant entity over time. Unfortunately, junk is junkier today, as illustrated by this chart [at left] from last October’s Global Financial Stability Report.

The fraction of CCC or lower-rated bonds approximately doubled from early 2007 to early 2009. And according to a recent report from Fitch, the fraction at the end of 2009 was still 27%.

Debt ranked in the BB category gained 39.1 percent in the past 12 months, underperforming the CCC tier by 66 percentage points, according to Bank of America Merrill Lynch index data.


H/T EconomPicData

The "risk trade" is currently clearly not in the early innings....... Looks like the Mantra Bullish. No Matter What & the "Moon Trade" ( brilliant!) is still alive & kicking.... ;-)

Der sog. "Risikotrade" befindet sich sicher nicht mehr im "Anfangsstadium"..... Sieht so aus als wenn das Motto Bullish. No Matter What sowie Ladies and Gentlemen, We Are Trading On The Moon ( brilliant!) momentan noch immer zu greifen scheint...... ;-)+

UPDATE:

PARTS OF THIS MARKET ARE LOOKING IRRATIONAL PragCap

Why Young People Should Buy Stocks on Margin Time H/T Denninger

We just survived the worst debt-fueled binge since the Roaring '20s. Now two professors at Yale University are suggesting we introduce leverage into a new realm of our lives —our retirement portfolios. TIME's Barbara Kiviat asked economists Ian Ayres and Barry Nalebuff to explain themselves.

You are advocating that people in their 20s and early 30s take all of their retirement savings and buy stocks on margin. Can you explain why that's not as crazy as it sounds?

"It's not as crazy as it sounds because it helps people better diversify risk across time"

Read this twice....

UBS: EQUITY MARKET RISKS APPROACHING EXTREMES PragCap

Irrational Exuberance Is Here: VIX Lowest Since July 2007 As Options Speculation Highest Since Dot Com Days

The VIX has just hit the lowest level since July of 2007 as Sentiment Trader reports that "speculation in the options market has spiked to its highest levels since the spring of 2000."
As i´ve said, not in the early innings.....

Wie gesagt, nicht mehr im Anfangsstadium......

Labels: , , , , , , , , , , , , ,

Monday, December 03, 2007

Danger At The Margin / Contrary Investor On Margin Debt

I assume there will be more margin calls down the road....

Man muß kein Hellseher sein um zu erahnen das es demnächst eine Menge Margin Calls geben wird.........

Danger at the margin FT Alphaville
ContraryInvestor.com is also concerned. In their latest Market Observations The "Other" Credit Market report for December they take an detailed look at the “other” credit market. Their first point is that historically margin debt has been a coincident, not a leading, indicator of a stock market peak

The latest spike in margin debt has corresponded with a big run in equity markets from summer 2006 to summer 2007, they note. It looks unsustainable.


But it’s not just the nominal debt balances that are pointing to trouble. ContraryInvestor.com looks also at the year on year rate of change in NYSE margin debt.

That growth rate has only spiked over 60 per cent on five occasions in the last fifty years - and one of those, in January 1993, was thanks to a change in methodology made late in the previous year.

The latest two growth peaks are showing in the next chart, below right.
NYSE margin debt passed the 60 per cent year on year growth mark in December 1999, and peaked in March 2000

In 2007, the rate of change level was breached in June. “The history of margin debt relative to equity market price movement over the last half-century is suggesting to us we’re at a high risk juncture right here,” says Contrary Investor.
Looking back through the corridors of history, the report adds that, excluding the anomalous 1993 spike, the S&P finished both nine and 12 months lower after all of the three other 60 per cent plus occurrences.

We’re living peak number five. The NYSE’s margin data seems to hold a warning from multiple viewpoints.

AddThis Feed Button

Labels: , , ,

Tuesday, March 20, 2007

Why Margin Debt Doesn't Matter / minyanville

this is a different view on the margin debt. click on the headline
hier mal ne andere ansicht in sachen margin debt. bitte auf die überschrift klicken


to be honest i find calling free credit = cash and putting up a bullish chart makes me not more comfortable with the amount of debt that is outstanding

um ehrlich zu sein finde ich die tatsache das der chart dadurch bullish aussicht das freie kredite als cash tituliert werden wenig vertrauenserweckend.


here is a good take from rodger rafter http://www.rebalancing.blogspot.com/

"you should relax less"

Bunch of hooey, if you ask me.

The title is a pretty good give away that it is an attempt to rationalize away the precarious situation of hoards of overleveraged small investors. The article isn't saying margin debt doesn't matter so much as it is saying those in cash will come to there rescue.

That's not how I expect things to shake out.The heavily marginated are ripe for a fall, just as they were in 2000. Sure, there's a bunch of cash sitting in accounts, but that will probably grow rapidly like it did from 2000-2002 if the market gets bearish enough. Look at the chart and you'll see it wasn't until the end of the bear market that the smart money went to work.

The real question should be why cash in accounts has been rising lately. Cash was on the rise from 1998 to 2000, as it has been lately. There's been too much liquidity flowing into the market, with not enough good buys left out there. LBOs have been putting cash into investor's hands at a ridiculous rate and many have had the sense to just sit on it rather than pay too much for what's out there.

People who are smart enough to be in cash now will probably be smart enough to wait out much of the coming downtrend as they did earlier in the decade.

thanks rodger!

Labels:

Monday, March 19, 2007

Credit Crunch Is a Sham...../ really? time will tell

this is a interesting report from Tony Crescenzi/the street.com. it shows that we have seen nothing yet. i´m pretty sure that the debt growth drivers have changed. from the private sector and real estate to the corporate sector. the monthly data that tracks the consumer credit shows clear sign of slowing down and is growing the least over the past years ( down to 2-3%.) http://tinyurl.com/2u545a . the party is over.

interessante daten. die treiber des kreditwachstum haben eindeutig gewechslet. die privaten haushalte können aufgrund der schuldenlast und sich verschlechternder kreditbestimmungen kaum noch weitere kredite aufnehmen. hier ist die party vorbei


we just have to look on our bloomberg or other newscreen to see all the leveraged buyouts that are fueling all stock markets around the world. the party is in full swing (i hope close to the peak.....) and as we have seen in the subprime market the u-turn caa happen over night....

ganz im gegenteil zum gewerblichen sektor der uns ja jeden tag mit neuen kreditfinanzierten rekordübernahmen überrascht und die aktienmärkte alleine am laufen hält. hier ist die party gerade kurz vor dem siedepunkt (hoffe ich zumindest...). und wie wir bei den subprimes gesehen haben kann sich die wende praktisch über nacht vollziehen......

and of course another source of credit is running amok. margin debt is hitting new highs. thanks to barry ritholtz. here are the details http://tinyurl.com/2pgnhh

und selbstverständlich darf da eine andere quelle des kreditwachstums nicht fehlen. margin debt läuft amok und erreicht neue rekorde (link oben)


i aslo wanted to highlight the leverage of all the hedge funds out there. here is one drastic example

ich möchte zudem noch auf die massive verschuldung der hedge fonds hinweisen. hier ein beispiel

Citadel trading costs hit $5.5bn http://www.msnbc.msn.com/id/15993706/ (must read)

More than 90 per cent of the investment expenses represent interests payments, including the cost of the roughly $100bn of net debt provided by investment and commercial banks


Right now, the hot topic is the subprime market. One of the biggest questions is whether this sector's problems will spill over into other areas of lending. In other words, will problems in the subprime market crimp overall lending and cause a credit crunch, which would then harm economic growth and potentially lead to a recession?

I closely follow data released every Friday at 4:15 p.m. ET by the Federal Reserve on the assets and liabilities of U.S. commercial banks

These data are an excellent gauge of whether any change in lending conditions is occurring. In this report, the Fed sums up the total amount of money extended by the nation's commercial banks to individuals, businesses and government entities via loans, leases and securities purchases. The data are comprehensive, meaning that if the problems in the subprime sector are broadening out, this will be obvious in the data.


The newest data released Friday squash the idea that a credit crunch is developing in response to recent subprime problems. The Fed's data show that bank credit expanded strongly in the week ended March 7, increasing $23.9 billion to $8.437 trillion. The rise follows other large gains over the previous five weeks, which saw bank credit expand at a 13% annual rate, which is faster than last year's gain of 11% and 2005's gain of 10%.

( the higher the dose the harder the ......../ je höher die doses desto kälter der entzug....)


Interestingly, recent increases in bank credit have been partly the result of steady increases in real estate loans, which reached a record $3.381 trillion in the latest week.

In addition to these data, it is notable that bond issuance has been very robust over the past two weeks, with issuance running several times the normal levels. Hence, many entities are looking for money (many of these have been financial companies), and investors have been very willing to give it to them


thanks to http://www.itulip.com/

here is more on this topic from russ winter http://tinyurl.com/233jpg

Labels: , , , ,

Tuesday, February 27, 2007

Kass: Short Side Never Looked So Good

wow! waking up today in germany and see the intraday chart of the us markets gives us skeptics and bears reward for almost 3 month of pain. i think with yesterdays "correction" some highly leveraged people are getting really nervous. and they should.

donnerwetter. nachdem ich mir gerade mit einem auge (mit dem anderen beim langlauf) die us intradaycharts angesehen habe denke ich das wir "skeptiker" für fast 3 monate entschädigt worden sind. ich wette das momentan einige hochgehebelte marktteilnehmer nervös werden. und die haben sicher allen grund dazu.


i agree 100% with doug kass and the only difference is that i´m still long gold. i find it funny how they try to blame it on china. almost every markets should have corrected a long tome ago. the fundamentals were worsening day by day. the worse the data the higher the stocks. it´s not china, its the economy stupid!

ich stimme mit doug zu 100% überein. einziger unterschied ist das ich noch immer long im gold bin. besonders lustig wie jetzt alles auf china abgewältzt wird. fakt ist das die märkte bereits vor einigen monaten hätten korrigieren müssen. teilweise hatte man das gefühl je schlechter die news desto besser für die kurse.


just ask cramer. recession is good, subprime meltdwon is good, housingcrash is good (funny because he has never seen a bubble......) his only argument was lower rates! after a recession he prays probably for a depression. this guy is really a clown (i´m too polite to call what he really is...). here are some from cramers worst
http://immobilienblasen.blogspot.com/2007/02/rip-van-winklevs-cramer-hussman.html


fragt mal cramer (die us ausgabe von förtsch, frick etc). der hat sich bis gestern ne fette rezession, einen crash im subprimesektor, einen crash im immobereich (merkwürdig da er die existenz eines bubble nicht erkennen konnte). sein einziges argument war das die fed dann ja die zinsen senken muß. nach der rezession hätte er wohl für die depression gebetet. der typ hat auf cnbc die höchsten einschaltquoten. will ais höflichkeit nicht sagen was ich von solchen typen halte. unter dem link oben ein paar highlights von ihm


I am on the road traveling today, but I wanted to say that on Monday, for the first time since early 2000, I went all in on the short side. That is a reflection of how negative I am about this market.

Despite too often sounding like the boy who cried "wolf" in light of the continued market ascent, I have spent the past several weeks outlining my investment rationale and my major concerns:

heightened debt loads among consumers, the government and hedge funds; rising mortgage credit losses, which will weigh on a spent-up, not pent-up consumer; nascent inflation, seen in rising raw materials spot prices and crude lately; the ever-present specter of geopolitical tensions; and corporate profit and profit margin vulnerability.

thanks to barry ritholtz http://bigpicture.typepad.com/

Above all, investors are not being paid for risk -- and excessive valuations are not being recognized. As Robert Marcin

pointed out Monday, today's median P/E of 20.5 times trailing earnings of the Value Line composite of 3,000 leading companies compares to 14.5 times at the market's top in the fall of 2000; meanwhile, credit spreads and volatility --expressions of copious complacency -- remain at record low levels.
Today was by far the largest increase (64.22%) in the VIX since 1990http://tickersense.typepad.com/


Here are some reasons we're at such a precarious point.

1. Brokerages and money center banks are rolling over badly and remain a negative short-term market tell.

2. Hedge fund net-long invested levels (61%) are at the highest level and the AAII survey has bears at the lowest level since December 2004.


3. The daytrading in the Chinese market has begun to eerily resemble daytrading in the Nasdaq, which peaked seven years ago. (The more things change, the more they are the same, though the location changes.)

4. Virtually every hedge fund has the yen carry trade on its books, and recent signs in the currency markets indicate that the trade is getting less compelling. (If it does begin to unfold, the young hot money -- especially in the emerging markets like China -- could reverse in a nanosecond).

5. Two weeks ago, England's Times of London published a report that Countrywide Financial would be acquired by Bank of America . Again, the shares rose by nearly 10%, though they have subsequently declined by nearly 15% as subprime problems have grown. The outsize reactions to less-than-legitimate sources is typical these days. (despite the crash in the subprime cfc reached almost an all time high!/trotz subprime crash fast ein ath )

6. History shows that four-year extensions of bull markets, out of deep oversolds, often morph into disaster: 1932-36 (1937 crash); 1957-61 (1962 crash); and 1982-86 (1987 crash). We're well into four years in the current stretch.

7. Writing again on history (and technical voodoo), over the last century every decade has seen a market crash/deep correction in the sixth or seventh year of that decade.

Above all, the lifeblood of the bull market is the availability of credit, and the subprime issues (dismissed by most, not surprisingly) are putting a halt to lending that for years has disregarded creditworthiness and plain common sense. As night follows day, personal spending will plunge just at a time when most believe the consumer is invincible.

The opportunities on the short side have never been more attractive, just as the signs of a breakdown of the impressive bull market run have started to appear -- a potentially lethal combination.

can´t wait for abby ....... thanks to http://www.wallstreetfollies.com/


i wanted to add that the latest action in the private equity sector with deals like eop/blackstone and the txu/kkr has shown me that the final stage of the excess is near.

make sure you read what will hopefully mark the peak of leveraged deals http://immobilienblasen.blogspot.com/2007/02/next-biggest-buyout-everkkr-may-buy-txu.html, http://immobilienblasen.blogspot.com/2007/02/kkrgoldman-spinning-utx-deal-as-green.html, http://immobilienblasen.blogspot.com/2007/02/commercial-property-madness-numbers-on.html

mir persönlich haben die letzten transaktionen der private equity firmen mit deals wie eop, txu aber auch hochtief etc gezeigt das nach oben nicht mehr viel steigerung möglich waren. kann jedem raten den wahnsinn und evtl. historischen konditionen der deals oben nachzulesen.

Labels: , , , , , , , ,

Wednesday, January 17, 2007

The Permanent Income Hypothesis / henry to / safe haven

great charts. but fundamental different views on the interpretation.

super chart. aber ne komplett andere interpretation.

One of our premises for the continuation of the bull market in the United States and for the economy to reaccelerate early this year is our belief that the U.S. consumer is not close to being tapped out. The perma-bears would claim that much of the "mortgage equity withdrawal" over the last few years went directly into consumption - but as I have discussed many times before, a significant chunk of the MEW actually went towards paying off (higher-yielding) debt, not consumption. Another chunk of it went towards home improvements or starting businesses - both activities that could be classified as investments or capital spending (which is good for future economic growth). (capital spending.....really, the home improvements.?...how many of the new businesses are dependend on the mew and the housingbubble...?/wirklich? hausverschönerungen...wieviele dieser neuen geschäftsgründungen basieren auf einer weiter steigenden immoblase?)

The reduction in higher-yielding consumer debt is directly reflected in the consumer credit growth numbers over the last few years, as shown in the following chart:

wow! he views it bullish that with almost $2 trillion of mew in the years 2004-2006 the consumer credit growth(excluding real estate debt) slowed a little bit.... if this is his thesis for a strong consumer going forward and the continuation of the bull market....... good luck!
mal ehrlich. über 2 billion$ an mew in den jahren 2004-2006 und das konsumentenkreditwachtum (ohne immobilien) hat sich lediglich leicht abgeschwächt. das wird hier als zeichen für einen weiter starken us konsumenten und einen bullishen aktienmarkt gesehen. viel glück!
the following chart showing the ratio between U.S. money market assets (both retail and institutional) and the market capitalization of the S&P 500

The ratio between money market fund assets and the market cap of the S&P 500 is probably not a great timing indicator - but what it does show is the amount of "cushion" that we have in order to insure against a significant market decline. While this indicator is telling us that we are closer to the end of the bull market than the beginning of one, it is also telling us that we are not close to exhaustion just yet. Based on historical experience, this author will not be too concerned until this ratio hits a reading of 15% or below.
Assuming that the amount of money market funds remains the same going forward, the market cap of the S&P 500 has to rise a further 13% before we see such a ratio. Based on the above study, we will remain 100% long in our DJIA Timing System.
here is another view from minyanville " Margin Debt, Cash and Bull Market Peaks"

Labels: , , , ,

Tuesday, January 09, 2007

Margin Debt, Cash and Bull Market Peaks / minyanville

what a great chart. make sure you read the related story (click on the headline). when you look at the chart there is really more room left to fuel the markets. scary...........

ein hammerchart. unbedingt die dazugehörige story lesen (überschrift klicken). unglaublich aber wahr. es scheint so als wenn noch mehr raum/kredit zur verfügung steht um das ganze noch weiter zu befeuern. beängstigend..........

thanks to jason goepfert and minyanville http://www.minyanville.com/gazette/bios.htm?bio=14


Labels: