Tony Dwyer Is Not Alone..........Of Course It Is Still A Good Time To Buy, Buy, Buy.....
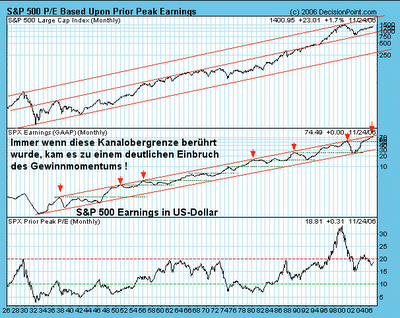
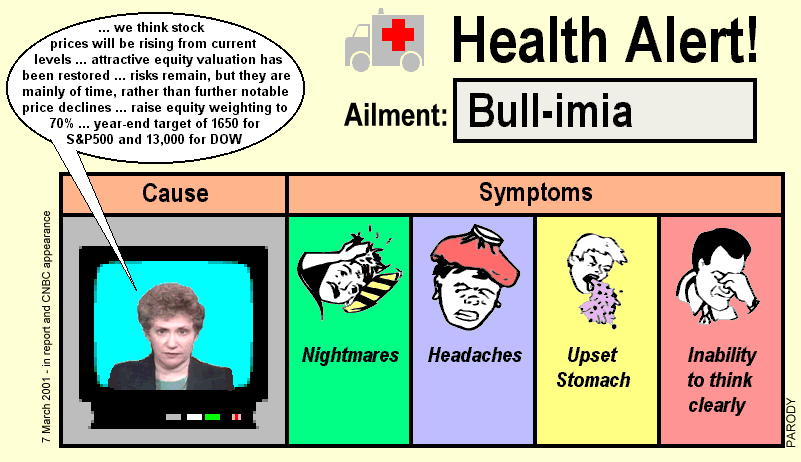
Welch "Überraschung"......Behaltet die nachfolgenden Daten im Hinterkopf wenn es wie tagtäglich in den Medien und auch der Fachpresse gebehtsmühlenartig wieder heißt "das Aktien auf Bewertung der 2011er Gewinne günstig sind"..... Ein eindrucksvolles "Schauspiel" in dieser Disziplin bietet Tony Dwyer mitsamt seinem "brillianten Playbook" für sein 2000 S&P Ziel im Jahr 2013 UPDATE: Dieser Typ ist mindestens ebenbürtig It's Not a 'V', It's Even Better, Look for New Highs by 2012..... Grundsätzlich mag es ja durchaus gute Gründe die für Aktien sprechen geben, man sollte aber sicherstellen das die Einschätzungen der "Experten" beim Auswahlprozess keinerlei Rolle spielen....Es sei denn man nutzt sie als Kontraindikator.... ;-)

Bespoke
Bloomberg surveys sell-side Wall Street strategists on a weekly basis for their year-end S&P 500 price targets. At the start of 2010, the average year-end S&P 500 price target was 1,225, which would have been a gain of just about 10%. As markets moved higher in the first quarter, strategists upped their year-end targets, and the current average target stands at 1,268. (In the table below, green shaded price targets are ones that have been increased so far this year. No strategists have lowered their targets since the start of the year.) A target of 1,268 translates into a gain of 13.68% for the year and 16.48% from current S&P 500 levels.Analysts Projecting 27% Gain in S&P 500 Defy El-Erian Bloomberg
There are no strategists with year-end targets that are lower than the index's current levels.
The real story here are not the S&P 500 targets from the "strategist" but that they have managed to increase the target since the beginning of the year.... Despite events like the Flash Crash ( "Cancel All Orders, Cancel All Orders....." ), "minor headwinds" when it comes to Sovereign Debt,China , for US companies an unfavourable strong $ , impact from the "Oil Spill" on drillers & still insolvent Banks it´s fair to say that ROSE COLORED GLASSES are still a must have item among way too many among "Wall Street Finest"... ;-)Combined price estimates from more than 2,000 forecasters tracked by Bloomberg show the S&P 500 will rise 27 percent in the next year, the fastest projected rate since February 2009, data compiled by Bloomberg show.
The rally above 1,350 will be led by industries most tied to the economy, according to analysts who boosted individual share projections by an average of 0.9 percent in May, the 14th straight monthly increase.
Should analysts’ forecasts for a 27 percent gain in the S&P 500 come true, the gauge would climb to 1,360 by next May, the highest level since June 2008.
Die eigentliche Botschaft sind nicht die angegebenen Kursziele, sondern vielmehr die Tatsache das diese trotz einiger unschöner Ereignisse die vermehrt seit Jahresbeginn aufgetaucht sind wie dem sog. Flash Crash ( "Cancel All Orders, Cancel All Orders....." ), "minimalen" Problemen wenn es um Sovereign Debt,China den für US Firmen ungünstigen "starken $" , seit dem BP GAU die Probleme der Ölförderer & die immer noch bemerkenswert schwachen Banken geht, munter fleissig angehoben worden sind..... Denke es ist keine Übertreibung zu sagen das eine ROSAROTE BRILLE unter etlichen von "Wall Street Finest" noch immer zur "Standartausrüstung" gehört.... ;-)
I´ll let "Mr. Anti Spin" David Rosenberg du some further "bashing"..... Do yourself a favour & subscribe to his free DAILY REALITY CHECK... SUPERB!
Überlasse es "Mr. Anti Spin" David Rosenberg noch mehr Wasser in den Wein zu gießen....Empfehle allen sich frei Haus die tägliche Dosis Rosenberg zu genehmigen....
AMEN...."It’s also fascinating to read the “Ahead of the Tape” column in the WSJ today and to read about the fabulous earnings performance of U.S. companies — a revival built on a weak U.S. dollar, accelerating global growth, fiscal stimulus and a steep yield curve.
Meanwhile, the consensus has just now gone ahead and projected peak earnings for 2011 just as each of these main crutches are reversing course."
McKinsey: Equity Analysts Are Still Too Bullish via Barry

This chart completes the not so glory picture when is comes to the credibility & reputation from "Wall Street Finest".... If you have the "guts" to read the "rationale" behind Goldmans bullsih call you should read Goldman: "We Raised S&P 500 EPS Estimates Despite Worst May Performance In Almost 50 Years"Moreover, analysts have been persistently overoptimistic for the past 25 years, with estimates ranging from 10 to 12 percent a year, compared with actual earnings growth of 6 percent.
Over this time frame, actual earnings growth surpassed forecasts in only two instances, both during the earnings recovery following a recession. On average, analysts’ forecasts have been almost 100 percent too high.”
Dieser Chart paßt hervorragend ins Bild unm das das wenig glorreiche Bild abrunden....Für alle die die Nerven haben und wissen möchten auf welchen "Modellen" die Schätzungen von Goldman basieren Goldman sollte Goldman: "We Raised S&P 500 EPS Estimates Despite Worst May Performance In Almost 50 Years" lesen....
UPDATE:
Profit-Margin Outlook for U.S. Is ‘Extremely Bad’: Chart of Day Bloomberg
Best Stocks Liked Least by Analysts Missing U.S. Gain Bloomberg
Labels: earnings quality, investor sentiment, peak earnings, profit margins, valuations, wall street finest
posted by jmf at 9:40 AM
0 comments


 What explains this apparent insouciance? It seems that investors reckon they cannot lose. “Take your pick,” says Gerard Minack, a strategist at Morgan Stanley: “Equity markets are either behaving as if the worst is over for credit and housing problems or they remain convinced that the [Federal Reserve] can offset whatever bad news may unfold.” In other words, bad economic news means the Fed will cut interest rates and good news means recession will be avoided.
 The dollar's decline has added impetus to the earnings of American exporters and multinationals with overseas subsidiaries.

 The potential for historical market relationships to change, and for new methods to outperform existing ones, is a question that constantly drives our research. It's why I've done such extensive studies on discounting models, the Fed Model, interest rate relationships, the effect of buybacks, and so forth. Still, my impression is that investors are easily worried by the possibility that “this time it's different,” and by the belief that normalized P/E ratios and the like haven't “worked” in the past few years. On that issue, it's essential to recognize that valuation is not a short-tem timing tool, but has its primary effect on market returns over periods of 7-10 years and beyond.


 Ökonomen geben allerdings zu bedenken, dass viele Firmen ihre relativen Gewinne mit milliardenschweren Aktienrückkäufen aufpolieren. Thomson Financial geht davon aus, dass die Unternehmen inzwischen 23 Prozent ihres Ertragswachstums allein diesen aktionärsfreundlichen Programmen verdanken. Durch den Rückkauf eigener Aktien sinkt die Zahl der außen stehenden Papiere. Dadurch erhöht sich automatisch der Gewinn je Akti.. "Es ist offensichtlich, dass der Einfluss von Rückkaufprogrammen größer wird", sagte Thomson-Direktor Michael Thompson dem Handelsblatt.
 Presently, the market's valuation on the basis of price/revenue, price/book, and price/dividend is higher than at any prior historical market peak on record except the 2000 peak.
 As I've detailed in recent weeks, that approach has ridiculous implications even in the data sample (1980-2000) that was used to construct it, and is quickly and easily verified as pure garbage in pre-1980 data, using any proxy remotely close to estimated “forward earnings


 You can also see that today's values are at the same level as they were about 8 years ago. Did I mention that the S&P 500 has underperformed Treasury bill yields since then? Ah, yes. I believe I did

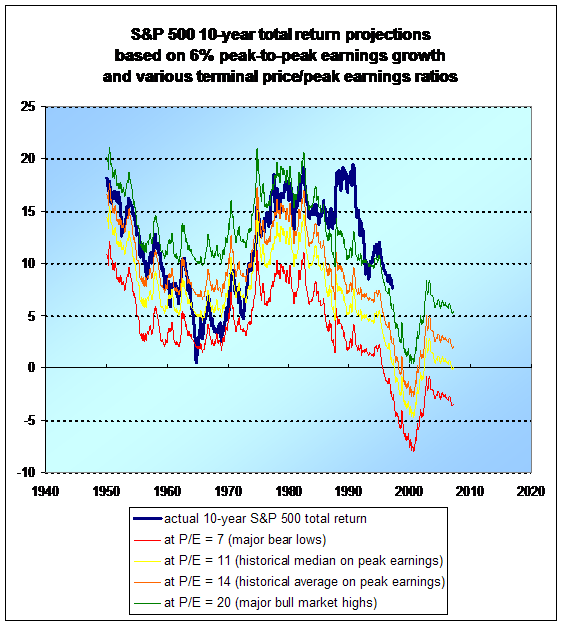
 As it happens, the simple, normalized earnings yield on the S&P 500 has been a remarkably good indicator of subsequent 20-year total returns for the stock market. In the chart below, I take the inverse of the price/peak-earnings ratio as a “normalized” earnings yield. Recall also that peaks in S&P 500 earnings over the past century have been well contained by a 6% annual growth trendline. (Finding that level today is easy. To quote Madge in the Palmolive commercial; “you're soaking in it”). In order to further normalize the earnings yield, I've added the amount of annualized earnings growth that would be required to bring the prevailing peak-earnings figure earnings at any point in time up to that 6% growth trend.