Friday, May 01, 2009

Abby Joseph Cohen 2009 vs Abby Joseph Cohen 2001.....Which Call Is Worse?

What´s a year without a "brilliant" call ( even more important the rationale behind the call ) from Abby Josef Cohen.....Just in time after a 30% plus (technical ) rally in the major indices worlwide.....In the past especially the calls from permabull Cohen were close to near and often long term market tops...... To my knowledge one of the better "contrary" indicators......

Was wäre ein Börsenjahr ohne Weisheiten von Abby Joseph Cohen.....Man beachte das brilliante Timing.... Rechtzeitig nachdem alle bedeutenden Indizes 30% und mehr gewonnen ( technisch bedingt ) haben..... Ein prima Kontraindikator. Die "Prognosen" vom Permabullen Cohen haben in der Vergangenheit zeitlich oft ein längfristiges Markthoch markiert...... Besonders wenn die Begründung für die avisierten Kursziele schon fast tragischkomischen Charakter haben bzw. man befürchten das die Schweinegrippe auch Wall Street erreicht hat...

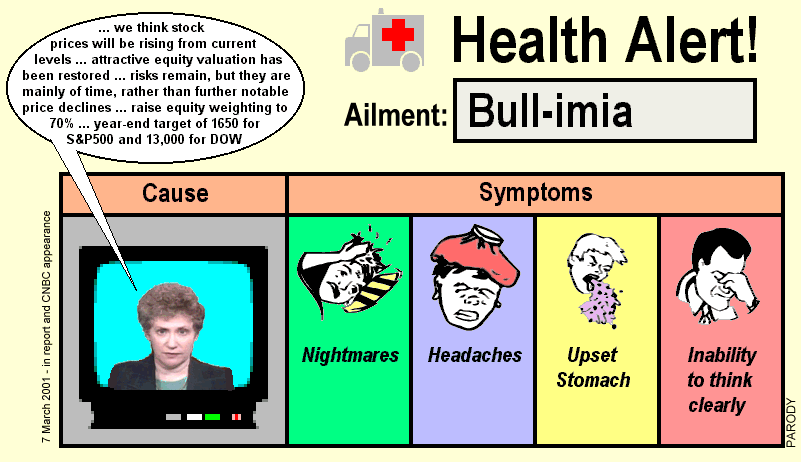
Call 2001 just bevor the collapse:

bigger/größer

Hat tip Wall Street Follies

Call 2009 S&P 500 at 880:

Goldman Sachs’s Cohen Says S&P 500 May Surge to 1,050

May 1 (Bloomberg) -- The Standard & Poor’s 500 Index may jump 20 percent to 1,050 over the next six to 12 months as investors buy stocks trading at low valuations, said Abby Joseph Cohen, Goldman Sachs Group Inc.’s senior investment strategist.

> Low valuations....? "Fair value based on recession earnings" ( Quote Cohen ) ? She is probably using the following model showing the "high" quality of earnings ( backing out large parts of costs doing business like write downs, restructoring charges etc / see also the update at the end of the posting) or she is the only one thinking the Fed Model ( see "Fed Model" Knowing What Ain't True ) is usefull.....

> Niedrige Bewertungen.....? "Faire Bewertung die auf rezessionsgestählten Ergebnisprognosen basieren" ( Zitat Cohen )? Mag ja sein das sie Ihre Bewertungsmodelle auf der nachfolgenden Rechnungsmodellen basiert die an Kreativität ( "Sonderfaktoren wie Abschreibungen, Restrulturierungskosten usw werden ausgeklammert ) kaum zu überbieten sind ( siehe auch Update am Ende ). Denkbar auch das Sie als einzige dem Fed Modell ( siehe "Fed Model" Knowing What Ain't True ) glauben schenkt...........


“You could see the market sustain at these levels,” Cohen, 57, said in a Bloomberg Radio interview. “We’re going to set a new trading range much higher than the trading range in February and March.”

Cohen was replaced as Goldman Sachs’s chief forecaster for the U.S. stock market a year ago. She had been the second-most bullish Wall Street strategist at the start of 2008, a year when the S&P 500 tumbled 38 percent to 903.25 for the steepest annual loss in seven decades. Cohen predicted in December 2007 that the index would end last year at 1,675. David Kostin took her job.

At least i think her 2009/2010 call will be closer to the target than her over 40 percent miss for the 2008 December estimate...... :-)

Immerhin wird sie wohl Ihre 40% Zielverfehlung Ihrer letztjährigen Prognose verbessern können...... :-)

UPDATE:

This just in from David Rosenberg via Zero Hedge . I highly recommend to read the entire link. Compare this to the call from Cohen.....

Den nachfolgenden Link via Zero Hedge empfehle ich allen die das Kontrastprogramm zu Cohen lesen wollen. Eine realistische und fundierte Marteinschätzung von einem der auch die bisherigen Probleme vorhergesen hat ( David Rosenberg ).

The market, as a whole, cannot be considered cheap

In the meantime, earnings forecasts are being trimmed steadily for the balance of the year. In fact, forward P/E multiple of 15x operating and 30x on reported EPS are not that compelling. So, we do not have a strong valuation argument. We do not have a strong earnings argument.

Compare the following chart with the former S$P500 1675 target from Cohen......

Vergleicht den nachfolgenden Chart mit dem vorherigen Kursziel ( S&P 500 1675 ) von Cohen.....

via Chart Of The Day
While the stock market is up sharply since early March, the economy as well as corporate earnings continue to suffer. Today's chart helps provide some perspective as to the magnitude of the current economic decline. Today's chart illustrates that 12-month, as-reported S&P 500 earnings have declined over 90% over the past 20 months (with over 90% of S&P 500 companies having reported for Q1 2009), making this by far the largest decline on record (the data goes back to 1936). In fact, real earnings have dropped to a record low and if current estimates hold, Q3 2009 will see the first 12-month period during which S&P 500 earnings are negative.

Labels: , , , , , , , ,

Monday, September 03, 2007

The problem with financials / Hussman

It is not hard to understand why common sense from Hussman is obviously not good for the business of Wall Street. I wanted to add another point that doesn´t makes thing better. I think if the financials would be forced to account conservatively the lots of the earnings would fall apart. If you want an example of how "creative" this process has become make sure you read Wells Fargo Gorges on Mark-to-Make-Believe Gains

Es ist aus nicht weiter verwunderlich das der gesunde Menschenverstand der jede Woche von Hussman unters Volk gebracht wird nicht gut für das Geschäft von Wall Street ist. Ich habe noch einen Zusatz zum Report zu machen. Ich bin mir ziemlich sicher das die Gewinne schon jetzt deutlich geringer ausfallen würden wenn die Finanzkonzerne konservativer bilanzieren würden. Als anschauliches Beispiel wie weit die "kreative" Auslegung der Bilanzvorschriften inzwischen gediehen ist bietet sich dieser Link an Wells Fargo Gorges on Mark-to-Make-Believe Gains

The problem with financials
We continue to carry a very low weight in financial stocks. Though the recent weakness in these stocks has prompted a great deal of interest in “bottom fishing,” my impression is that such efforts are based on the same untempered assumptions of high and growing earnings in this sector that existed months ago. P/E ratios ought to be well below historical norms when those P/Es are based on record earnings and record profit margins. In my view, existing valuations are based on untenable assumptions of permanently high profit margins in this sector, with optimistic growth assumptions as well.

In 2000, this was the essential problem with the technology sector. It was some time before Wall Street's expectations caught up with the reality that profit margins are cyclical and that early declines off of overvalued peaks do not constitute bargains.

I expect that in the next year or two, we will observe at least one quarter, and more likely a full year, in which the entire profit of the U.S. banking sector is consumed by loan losses.

Consider, for example, the latest FDIC Banking Profile, which was published based on June 30, 2007 data (before the recent liquidity crisis emerged). In that report, the FDIC noted that the ratio of loan loss reserves to total loans remains at a 32 year low. As for the portion of those loans that are in trouble, the FDIC notes “for the fifth quarter in a row, reserves failed to keep pace with the increase in non-current loans.” The industry's “coverage ratio” of reserves to non-current loans fell to the lowest level since the third quarter of 2002, while non-current loans posted the largest quarterly increase since the fourth quarter of 1990. Recall that 1990 and 2002 were periods when recessions were already well underway. If we're already seeing these signs of credit stress at the peak of an economic expansion, the figures we observe in a recession are likely to be a lot worse.

> Make sure you read Is WaMu the Next Countrywide? to see how ugly the situation and the quality of earnings already is.

> Ich kann jedem empfehlen Is WaMu the Next Countrywide? zu lesen um zu verstehen wie übel die Lage selbst bei einigen großen Instituten inzwischen aussieht.

> The impact on total S&P 500 earnings is if you take this table from Bespoke already over 30 percent. I have seen charts that include the impact of the financial arms from companies like GE, GM, F, Harley etc and the number is closer to 30 perecnt and 40% of the profits. Either way you look at it this number is going to decline significantly.

> Der Gewinnanteil an den gesamten S&P 500 Gewinnen liegt wenn man nach der Übersicht von Bespoke geht bei über 30%. Ich habe auch schon Aufstellungen die zusätzlcih die Finanarme von GE, GM, F, Harley usw miteinrechnen. Dann verschieben sich die Zahlen Richtung 30 und 40 Prozent. Wie man es auch dreht und wendet diese Anteile werden sich in den nächsten Jahren massiv gen Spüden bewegen.

> Here Bear Stearns as an example. I´ll bet that the real number for 07 and 08 will be much lower. How can any Analyst come up with another conclusion is a mystery to me. They should know that Bear is viewed as the most vulnerable as it generated 44 per cent of its revenue from its fixed-income business, according to Bernstein Research. It also has least exposure to less troubled markets outside the US. Here is another good story why a slump in earrnings is very likely American Investment Banks "Shots In The Dark" Economist

> Nehmt Bear Stearns als Beispiel. Ich gehe jede Wette ein das die tatsächlichen Gewinne in 07 und 08 deutlich niedriger sein werden. Wie ein Analyst hier zu einer anderen Meinung kommen kann ist mir schleierhaft. Ich gehe davon aus das denen der Fakt bekannt ist das Bear 44% seiner Umsätze im Anleihebereich macht und fast ausschließlich auf die USA beschränkt ist. Hier ein guter Link der zeigt warum dei Gewinne aller Investmentbanken wohl demnächst deutlich niedriger ausfallen dürften. American Investment Banks "Shots In The Dark" Economist

EPS TrendsCurrent Qtr
Aug-07
Next Qtr
Nov-07
Current Year
Nov-07
Next Year
Nov-08
Current Estimate 2.323.1912.7313.62
7 Days Ago 2.783.4813.4314.47
30 Days Ago 3.364.0514.6915.76
60 Days Ago 3.394.0414.7215.78
90 Days Ago 3.504.2115.2815.95

> And when you look at this table of pending LBO deals via the NYT it should be clear that the investmentbanks are also facing "loan" trouble.....

> Und wenn man sich diese Übersicht der noch zu finanzierenden LBO Deals von der NYT ansieht kann man sich leicht ausrechnen das die Investmentbanken ebenso wie die gewöhnlichen Banken einige "Kreditprobleme" zu lösen haben.... The Banks Behind the Biggest Buyouts

James Grant put it this way – “Benjamin Graham and David L. Dodd, in the 1940 edition of their seminal volume ‘Security Analysis,' held that the acid test of a bond or a mortgage issuer is its ability to discharge its financial obligations ‘under conditions of depression rather than prosperity.' Today's mortgage market can't seem to weather prosperity.”

As of June 30, 2007, the net income of all FDIC insured banking institutions totaled $36.8 billion. At an annual rate, that represents about 2% of all loans outstanding. Meanwhile, net charge-offs for bad loans were already running at an annual rate of about 0.50% in June. That's in a strong economy, before the recent problems, and loan loss reserves didn't even budge from a 32-year low. Net charge offs could easily quadruple in a mild recession.

Importantly, the problems go far beyond sub-prime. In its June 30 report, the FDIC noted “all of the major loan categories posted both increased net charge offs and higher net charge off rates.” Overall, net charge-offs jumped by over 50% from year-ago levels, with a jump of over 60% for consumer loans and over 70% for industrial loans. These percentage jumps are so high because they are off of such a low base, which underscores the extent to which observed profits in the financial sector have been unhindered by loan losses in recent years. Charge-off rates have not soared as much for credit cards, but this is because the existing level of charge-offs is already high (representing over 3% of the total amount volume of credit card balances, year-to-date). In short, the problems are in all categories, and given the thin coverage of the banking system for such losses, rising charge-offs and loan loss reserves are likely to bite deeply into earnings.

For some financials, relatively high dividend yields are being touted as a measure of safety and quality for investors. The difficulty is that if earnings come under pressure, a greater share of earnings will be required to cover those dividends.

> Let us hope that the Analysts are not so far behind the curve as they were with the homebuilders Number Of The Day ....Earnings Estimates for Homebuilders..... But as i said before....Common sence isn´t good for business......

> Bleibt zu hoffen das die Analysten in diesem Fall nicht ganz so daneben liegen wie bei den Buildern Number Of The Day ....Earnings Estimates for Homebuilders..... Wie ich aber schon vorher angemerkt habe ist der gesunde Menschenverstand nicht förderlich um Geschäfte an Wall Street zu machen.....

Now the bust is taking a brutal toll. In January, industry analysts predicted that the 10 biggest builders would have average earnings per share of $3.69 for 2007; the latest forecast is for a loss of $1.18.

Of course, the long-term return is equal to the dividend yield plus the long-term growth rate of dividends. Though I don't expect forced dividend reductions for major U.S. bank stocks, I do believe that the growth rates assumed by Wall Street here are overstated. And while a well-covered dividend can produce a lower “duration” and therefore a smaller sensitivity to broad market fluctuations, it does not in itself produce an undervalued stock. ....

In any event, my impression is that the problems for financials are just beginning, and that the risk premiums demanded by investors are likely to rise. As investors have seen throughout market history, stocks having rich valuations, weakening fundamentals, and rising risk premiums typically don't constitute great bargains.

> Now compare this to the "call" from Wall Street finest.... They obviously didn´t use any realistic earnings estimate. The only way they can justify this target is probably the "Fed Model". But as Hussman also has pointed out in "Fed Model"Knowing What Ain't True every body that has to use this argument is at best clueless (try to stay polite)........

> Nun vergleicht diese Aussagen mal mit den unvermeindlichen Zielen und Prognosen für den S&P 500. Anhand von realitischen Gewinnschätzungen sind diese Ziele sicher nicht erstanden. Die einzige Erklätung wäre das das brüchtigte "Fed Model" eine gewichtige Rolle gespielt hat. Wie abermals Hussman in "Fed Model" Knowing What Ain't True geschrieben hat ist jeder der dieses Argument heranzieht im besten Fall ahnungslos ( höflich formuliert).......

Disclosure: Short KBW Mortgage Finance Index

AddThis Feed Button

Labels: , , , , , , , ,

Sunday, August 26, 2007

Knowing What Ain't True / Hussman

Once again it is good to have a sober guy like Hussman who is the perfect "anti spin" to the crowd that is using false analyse to spin the markets to "cheap" valuation. So everybody that will use the mantra" Fed Model" is obvioulsy clueless, lying, desperate, drunk ....... ;-) And we will hear this a lot down the road when the Fed is cutting during the next years.

Es ist immer wieder beruhigend die nüchterne Analyse von Leuten wie Hussman zu lesen. Er ist so ziemlich das genaue Gegenteil der sonst üblichen Zunft die in allen nur erdenklichen Wegen diesen Markt als "günstig" erscheinen zu lassen. Allen die also das Argument "Fed Model" benützden um den Markt günstig zu rechnen sind entweder ahnungslos, lügen, verzweifelt, betrunken .....;-) Und da die Fed in den nächsten Jahren etliche Zinssenkungen durchführen wird dürfte das ein Hauptargument der Bullen werden.

Have historically reliable valuation methods become meaningless? Has the underlying relationship between valuations and subsequent market returns broken down?
The potential for historical market relationships to change, and for new methods to outperform existing ones, is a question that constantly drives our research. It's why I've done such extensive studies on discounting models, the Fed Model, interest rate relationships, the effect of buybacks, and so forth. Still, my impression is that investors are easily worried by the possibility that “this time it's different,” and by the belief that normalized P/E ratios and the like haven't “worked” in the past few years. On that issue, it's essential to recognize that valuation is not a short-tem timing tool, but has its primary effect on market returns over periods of 7-10 years and beyond.

As Will Rogers once said, “it ain't what people don't know that hurts ‘em – it's what they do know that ain't true.” The fact is that many “new era” arguments have no provable basis even in the data of the past decade, much less in long-term historical data.

Long-Term Return Projections - The Tale of Two Models

This next brief section should be my last Fed Model piece for a while :)

Consider the two alternative models below. The first presents the 7-year annual return for the S&P 500 implied by the Fed Model. The green line is based on a “normal” 10% annual total return, plus the amount of over/undervaluation implied by the Fed Model, amortized over 7 years. The blue line is the actual 7-year total return of the S&P 500.

Note that the relatively low readings in 1987 and the 1998-2000 period were the only times that the Fed Model would ever have been materially negative, and so are the only times the projected 7-year market return dipped materially below 10%.

Fed Model: Projected 7-Year S&P 500 Total Returns vs. Actual


The above chart does not look materially different if one uses, say, the Treasury bond yield + 3% as the “normal” S&P 500 return, so I chose a constant 10% norm so that all the variation in that green line is driven by Fed Model itself.]

Now consider 7-year projections based on the simple S&P 500 price/peak earnings ratio. Note that the fit is remarkably close, even without adjusting for profit margins (which further improves the fit). Indeed, the only material outliers were the 7-year period (starting in late 1967) that ended with the brutal market lows of late 1974, and a set of 7-year periods from about 1990 to 1996 that ended in the heights of the market bubble. Note also that while the 7-year projection in 2000 was more negative than actual returns have been, those actual market returns have still been in the low single digits since 2000, and then only because valuations returned to present, still rich levels.

Price/Peak Earnings Ratio: Projected 7-Year S&P 500 Total Returns vs. Actual

Currently, the 7-year projection for S&P 500 total returns is about 5% annually.

Look at the enormous swing from extreme undervaluation and high projected returns in the early 1980's to extreme overvaluation and low projected returns by 1998. This is the period during which the Fed Model was constructed. The essential error of the Fed Model is that it is based only on this period, and assigns nearly all the corresponding movement in earnings yields to a “fair value” relationship with 10-year Treasury yields. According to the Fed Model, the market was only slightly undervalued in 1982. That's insane. Again, my passion about this particular fallacy is that it has crept into virtually all of Wall Street's current valuation analysis, though under countless guises, such as “capitalized earnings models ” or “bond-equivalent P/Es” or “forward operating multiples.” Investors will be badly hurt by these notions. ....

With that, I think I'm done with Fed Model studies for a while. I've done my best to warn loudly, I've put the data out there, and have analyzed this thing to pieces. The Fed Model has no theoretical validity as a discounting model, is a statistical artifact, would never have been materially negative except in 1987 and the late 1990's (even in 1929 or 1972), yet views the generational 1982 lows as about "fairly valued," is garbage in data prior to 1980, and vastly underperforms proper discounted cash flow models and normalized P/E ratios. If investors still wish to follow the Fed Model, my conscience is clear, and my hands are clean.

Fed to the Rescue?
As I've noted in recent weeks, the Federal Reserve has been doing exactly what it should be doing – acting to maintain the soundness of the banking system. The Fed's intent here is not to absorb private losses. It is to make sure that banks don't have to contract their loan portfolios because of short-term withdrawals of funds. Though the Fed did open itself to slightly more credit-sensitive collateral, these securities are still investment grade and generally short-term in nature. Again, since these securities are collateral only, the creditworthiness of the underlying mortgages only becomes an issue for the Fed if the banks default on repaying their borrowings to the Fed. At that point, we've got far bigger problems.

It's important to distinguish between Fed actions to maintain liquidity in periods of crisis and Fed actions intended to affect the volume of lending more generally. As I've frequently noted, since reserve requirements were eliminated in the early 1990's on all bank deposits other than checking accounts, there is no longer any material connection between the volume of bank reserves and the volume of lending in the banking system. In normal circumstances, the Fed is simply irrelevant. The issue at present is that there is an unusual spike in the demand for reserves in the banking system. This is exactly the situation in which the Fed does have an important role.

Though the Fed will most probably cut the Fed Funds rate by half a percent, possibly all in the September meeting, or perhaps split between September and October, I don't believe that such an easing has much capacity to eliminate the inevitable default problems ahead in the mortgage market. As Nouriel Roubini has pointed out, there is a major difference between illiquidity (which Fed operations have a good potential to offset) and insolvency (which can be offset only by explicit bailouts at taxpayer expense, as we saw during the S&L crisis). My impression is that most of the worst credit risk is held outside of the banking system, so there is little concern that losses will need to be covered by deposit insurance. A greater share is probably held by investment banks and hedge funds, and my impression is that taxpayers will be hard pressed to allow Congress to use their tax money to finance the bailout of Wall Street financiers, when they've got their own mortgage bills to pay.

As a side note, I'm intrigued that investors have been so willing to lower their guard about credit concerns and the potential for continued blowups, based on nothing but the short-term interventions of the Fed. Most likely, the worst credit risks are being held in the hedge fund world, where reporting is monthly and nobody has to say nothin' until the month is over.

And on the subject of what investors know that ain't true, it's not clear that investors should really be cheering for an environment in which the Fed would be prompted to cut rates because of recession risk. Recall that the '98 cuts were largely due to illiquidity problems from the LTCM crisis, not because of more general economic risks. In contrast (with a nod to Michael Belkin), below are a few instances when the FOMC successively cut the Fed Funds rate in attempts to avoid recession: 2000-2002 and 1981-1982. Those cuts certainly didn't prevent deep market losses. Speculators hoping for a "Bernanke put" to save their assets are likely to discover - too late - that the strike price is way out of the money
AddThis Feed Button

Labels: , , ,

Sunday, July 08, 2007

Interest Rate Intuition / Hussman On The "Fed Model"

Excellent anti spin from Hussman. Keep this in mind when the "eyperts" try to spin bad economic news into gold (lower yields, higher stock prices) . Hussman shows that this is in the longe term just bubbletalk. But i have the feeling that long term is today often viewed until the next jobs report, the next cpi number etc...... Click on the headline to read the entire report
Großartiger Bericht zu dem oft zitierten "Fed Model" von Hussman. Man sollte die "Experten" nicht für voll nehmen wenn Sie dieses Argument undifferenziert bringen. Das passiert immer dann wenn schlechte Daten in positive für die Börsen umgedeutet werden (niedrige Renditen, steigende Aktienkurse). Hussman zeigt sehr schön das dieses Argument langfristig aus dem Reich der Fabel stammt. Da ich aber eh immer mehr das Gefühl habe das langfristig heutzutage (speziell in den USA) häufig nur bis zum nächsten Arbeitsmarktbericht, der nächsten Fed Sitzung etc bedeutet....... Klickt bitte auf die Überschrift um den kompletten Bericht zu lesen
It continues to fascinate me that investors are entirely willing to base their financial security on concepts that can be wholly disproved with even a cursory look at historical data. The Fed Model is the predominant example of this at present. The following chart should be sufficient to reiterate that the effect of interest rates on stock valuations is vastly overrated, and that raw earnings yields (particularly based on peak earnings to date) explain subsequent market returns far better than indicators that “adjust” for interest rates in the way the Fed Model does.

The truth is that the relationship between stocks and interest rates is far more nuanced than the Fed Model assumes.

Since 1950, the average yield on the 10-year Treasury bond has been just below 6%, while the average price/peak earnings multiple on the S&P 500 has been slightly over 14. For simplicity, we'll use those levels to define bond yields as “low” or “high” and to define stock valuations as “cheap” or “expensive” relative to long historical averages. Also for simplicity, we'll classify interest rates as “falling” when the 10-year Treasury yield is below its level of 6 months earlier, and “rising” otherwise.

Our intuition should immediately suggest that stocks probably perform best when valuations are cheap and interest rates are both low and falling. We should also expect that such favorable conditions would not have been observed too often. As it happens, that intuition is correct. That combination of conditions has historically occurred only about 7% of the time, but during those periods, the S&P 500 has achieved average annualized returns of 31.72%.

In contrast, our intuition should suggest that stocks probably perform worst when valuations are expensive and interest rates are both high and rising. Again, that intuition is correct. Such a combination of conditions has historically occurred about 10% of the time, and during those periods, the S&P 500 has achieved average annualized returns of 3.05%, clearly below Treasury bill yields, and generally with a great deal of volatility as well. When interest rates have been high and rising, the total return on the S&P 500 has been muted at about 4.00% annualized even when stocks have been relatively cheap.

Low interest rates are no panacea
Beyond those conditions, however, the intuition of the typical investor is likely to be badly off the mark. The reason is that investors have come to believe that low interest rates are a good thing for stocks in general, when in fact they are only a good thing if stock valuations are cheap. Importantly, low interest rates are of no help to stocks when stock valuations are rich. Contrary to the bad intuition that the Fed Model instills in the minds of investors, relatively low interest rates (at least on the basis of 10-year bond yields) are not nearly sufficient to justify or offset the negative effect of rich stock valuations. ....

In general, high stock valuations coupled with low interest rates (as we have now) have historically been symptomatic of a fully priced, overly optimistic market, with little margin for error.

With stock valuations rich, interest rates still relatively low but clearly rising, just 18% of investment advisors bearish, and short-term trends overbought, my hope is that investors do not allow the excitement (or frustration) of a market near new highs to obscure the very real danger here for long-term investors.


AddThis Feed Button

Labels: , , , ,

Sunday, June 17, 2007

New Economy, or Unfinished Cycle? / Hussman

tough times for rational investors like Hussman. to me it more an more obvious that only a major "credit event" in the lbo/takeover mania can shake the markets. to be honest i thought that this event happened in February in subprime........

harte zeiten für rationelle investoren wie Hussman. es sieht immer mehr so aus das eizig und allein ein "unfall" im kreditsegment der lbo/übernahmen etwas ändern kann und die märkte nachhaltig urchschütteln kann. um ehrlich zu sein dachte ich das dieses ereignis bereits im februar im bereich subprime kredite stattgefunden hat......

Presently, the market's valuation on the basis of price/revenue, price/book, and price/dividend is higher than at any prior historical market peak on record except the 2000 peak.

On the basis of normalized profit margins, the current P/E for the S&P 500 would be about 25 times record earnings rather than the (still elevated) multiple of 18.4.

Even if we give only 25% weight to that normalized value, and give 75% weight to the prevailing multiple, the resulting P/E for the S&P 500 is still over 20, and is about the same as what prevailed prior to the 1929, 1973-74, and 1987 market plunges.

This market is only “cheap” if one couples non-GAAP “forward operating earnings” with the Fed Model. As I've detailed in recent weeks, that approach has ridiculous implications even in the data sample (1980-2000) that was used to construct it, and is quickly and easily verified as pure garbage in pre-1980 data, using any proxy remotely close to estimated “forward earnings

Labels: , , , ,

Sunday, May 20, 2007

How Much Do Interest Rates Affect the Fair Value of Stocks? / Hussman

the fed model.......why does this remind me always on larry kudlow....?

das fed model wird leider auch bein uns noch viel zu oft zur "kurszielermittlung" der aktienmärkte herangezogen.

.... To estimate fair value, it is crucial to normalize earnings (rather than using “forward operating earnings” without correcting for the level of profit margins or the position of earnings within the economic cycle, as Wall Street seems eager to do here).

But what about interest rates? Sure, S&P 500 earnings are pushing along the very top of the 6% long-term growth trend that has repeatedly connected earnings peaks across economic cycles over the past century, and the S&P 500 currently trades at over 18 times those record earnings. Sure, when earnings have been similarly elevated in the past, the P/E multiple on those “top of channel” earnings has averaged only about 10. Sure, on normalized profit margins, the S&P 500 P/E would be about 25. Sure, profit margins have repeatedly experienced mean-reverting cycles over time. But this time it's different! After all, the current interest rate on the 10-year Treasury bond is a whole 1.4% below the average level of 10-year Treasury yields since 1950, and the year-over-year inflation rate is currently a whole 1.6% below the average inflation rate since 1950. Doesn't this mean that stocks deserve to be valued 60-80% higher than the historical norms?

If you watch CNBC for a few minutes, you'll immediately hear some analyst claim that stocks are cheap because the “forward earnings yield” on the S&P 500 is higher than the 10-year Treasury yield.
The next analyst will just say that “stocks look cheap compared with bonds.” The next will offer some strange convolution of the Fed Model, like “Sure, P/E multiples are above average, but bonds are trading at a P/E of 21.” After a short break from the monotony by some kind of circus clown playing with horns and buzzers, another analyst then comes on saying how the firm's “valuation model” (which is driven by forward operating earnings and interest rates) implies that stocks are 20% undervalued.

Wall Street is presently managing trillions of dollars of other people's money on the basis of a single toy model, originally discovered in a packet at the bottom of a Cracker Jack box. Despite the superficial appearance of being some sort of discounting model (with the earnings yield in the numerator and the interest rate in the denominator), the Fed Model doesn't actually map into any reasonable model of discounted cash flow valuation without making odd and counter-factual assumptions about the relationship between growth, payouts, interest rates, and risk premiums.

The Fed Model asserts that earnings yields and Treasury yields have a 1-to-1 relationship, that stocks are undervalued anytime the earnings yield on the S&P 500 is higher than the 10-year Treasury yield, and that the gap between earnings yields and interest rates is the prime determinant of subsequent market returns.
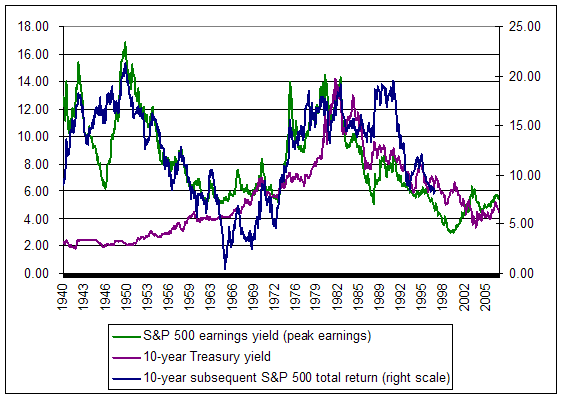
It speaks volumes about the shallow analysis on Wall Street these days that all of these beliefs can be dispelled in a single chart.


There is, in fact, no stable relationship between earnings yields and interest rates. The relationship is actually negative in data since 1929, is marginally positive (but statistically insignificant) in data since 1950, and is only strongly positive in data from 1980 through 2000 as a statistical artifact of the disinflationary period from 1980 to 2000.....

It is that period since 1980 that is the entire basis for the Fed Model. In effect, the Fed Model looks at the decline in earnings yields since 1980, and loads the entire explanation on the decline in interest rates. What actually happened is that you had a second factor – the move from extreme undervaluation (abnormally high earnings yields) to extreme overvaluation (abnormally low earnings yields). The true “fair value” relationship between earnings yields and interest rates is nothing close to 1-for-1.


Statistically, the Fed Model simply doesn't work......

How much do interest rates affect the fair value of stocks?
In short, interest rates affect “justified” stock valuations when 1) the interest rate changes do not pass through to equal changes in earnings growth, and either; 2) the change in interest rates can be expected to be permanent, rather than damping out over time, or; 3) the change in interest rates is based on a security with the same effective duration as stocks. The historical data do not support the notion that fluctuations the 10-year Treasury yield should cause wide swings in “justified” stock valuations.

But that doesn't mean that interest rate fluctuations aren't important…


The importance of trends in interest rates
When we think about the effect of interest rates on the stock market, we have to make a major distinction between the level of interest rates, and the trend of interest rates.

What we've established so far is only that the level of interest rates (at least on the basis of short or intermediate term bonds) does not justify large changes in the “fair” multiple applied to stocks. Within a wide range of movement, changes in the level of interest rates normally warrant only one or two points of variation in “fair” P/E multiples. The remainder of the actual fluctuations in P/E multiples reflect changes in the long-term attractiveness of stocks.

Having addressed the question of "fair value," we can ask a different question – what happens when stocks become significantly overvalued or undervalued? Regardless of the level of interest rates, does the trend of interest rates affect how quickly valuations revert toward more normal levels? The answer here is a resounding “yes.”.....

.....In contrast, when valuations are high and risk premiums are already thin, rising interest rates contribute to upward pressure on risk premiums and downward pressure on stock prices (especially when interest rates are rising across a range of maturities, coupled with deteriorating breadth, overbought conditions, dull trading volume and other factors).

Consider a very basic cross-section of valuations and interest rate trends using data since 1950. Specifically, we'll place P/E ratios into 3 classes: below 12, 12-18, and above 18. We'll classify the 10-year Treasury yield as “falling” if it is below its level of 6 months earlier, and “rising” otherwise. Clearly, this is an extremely simplistic classification setup, but even here we can see the combined impact of valuations and interest rate trends. The following table provides the annualized total return and volatility for the S&P 500 based on each set of conditions.

Treasury yield falling

Treasury yield rising

Annualized return

Annualized volatility

Annualized return

Annualized Volatility

PE <>

26.32%

11.86%

10.99%

13.74%

PE 12-18

18.88%

13.70%

4.90%

16.03%

PE > 18

8.94%

16.53%

-0.41%

18.57%


Notice that rising interest rate trends are invariably accompanied by weaker returns and greater volatility, regardless of the level of valuations.

So as noted at the outset, we often observe very good buying opportunities in stocks when valuations are cheap and interest rates suddenly decline. Conversely, we often see deep market declines when valuations are rich and interest rates suddenly advance. One need not use an inept tool such as the “Fed Model” to identify these instances.

Capitulating at the highs
.... At times like the present (as in 1999 and 2000) when the market advances despite conditions that have historically produced poor returns, it is easy to capitulate at the highs, and buy into a market that seems to be “running away.”..

For that reason, we can't have any assurance that the market will roll over into a bear market next week, next month, next quarter or even next year. But we can have reasonable confidence that markets will continue to cycle between great optimism and great despair. With stocks at over 18 times top-of-channel earnings on record profit margins, with the major indices at multi-year highs, with short-term trends easily through the upper Bollinger bands at the monthly, weekly and daily frequencies, with 54.3% of advisors bullish and only 19.6% bearish according to the latest Investors Intelligence figures, and with 10-year Treasury yields higher than they were 6 months ago, it should be reasonably easy to determine which extreme the market more closely resembles at present.

Overvalued, overbought, overbullish, yields rising. o-v-o-b-o-b-y. Hmm. That sounds familiar.

Labels: , , ,