There maybe are legitimate reasons to buy stocks, but a favourable opinion from "Wall Street Finest" should definitely not play any role among your screening process .... Except you use them as a "contrary indicator".... ;-)
Grundsätzlich mag es ja durchaus gute Gründe die für Aktien sprechen geben, man sollte aber sicherstellen das die Einschätzungen der "Experten" beim Auswahlprozess keinerlei Rolle spielen....Es sei denn man nutzt sie als Kontraindikator.... ;-)
On a valuation basis, the S&P 500 remains about 40% above historical norms on the basis of normalized earnings. The disparity between our valuation assessment and the putative undervaluation being touted by Wall Street analysts is so great that a few remarks are in order. First, virtually every assessment that "stocks are cheap" here is based on the ratio of the S&P 500 to year-ahead operating earnings estimates, and often comes with a comparison of the resulting "earnings yield" with the depressed 10-year Treasury yield. What's fascinating about this is that this is the same basis on which analysts deemed stocks to be about 40% undervalued just prior to the 2007 top, following which the market plunged by more than half.
To properly understand the price-to-forward operating earnings ratio, you have to recognize that operating earnings exclude a whole host of charges - what some observers correctly call "recurring non-recurring" charges. These include large and often quite regular losses that the companies deem, often on the thinnest basis, to be detached from their core business - even if the losses are directly related to their core business.
When you hear analysts say that the historical average P/E ratio is about 15, you have to recognize that this is the normal P/E based on trailing 12-month earnings after subtracting all writeoffs and other charges. Forward operating earnings are invariably much higher, and it turns out that the comparable historical norm, as I discuss in that 2007 piece, is only about 12. If you exclude the late 1990's bubble valuations, you get a historical norm closer to 11.5. The 1982 and 1974 market lows occurred at about 6 times estimated forward operating earnings
A final observation is crucial. Current forward operating earnings estimates assume profit margins for the S&P 500 companies that are nearly 50% above their long-term historical norms. While we did observe such profit margins for a brief shining moment in 2007, profit margins are extraordinarily cyclical. Investors will walk themselves over a cliff if they price stocks as if profit margins, going forward, will be dramatically and sustainably higher than U.S. companies achieved in all of market history.
They also ignore the large percentage of reported earnings that are actually quietly distributed to corporate insiders through the issuance of stock and options.
They blindly accept that "share repurchases" are somehow a pleasant distribution of earnings, whereas the majority of share repurchases are actually made by companies to do nothing more than offset the dilution from stock shares and options granted to insiders.
A good question to ask in the years ahead, immediately after profits are reported, is "how much of this figure is actually delivered to shareholders?" If you've been attentive over the past decade, the answer turns out to be much closer to the dividend yield than to the operating earnings yield that companies have reported.
For a moment, at least, it is good to be a corporate insider, particularly at major financial companies.
First, you get to report productivity gains and "operating profits" - not by making smart investments in productive assets, but instead by writing up debt thanks to Treasury intervention, by misstating your balance sheet thanks to FASB changes last year, and at industrial firms, by cutting the number of workers per unit of capital.
Next, you quietly write off large losses on bad investments and unrecoverable loans as "extraordinary expenses," to which investors pay no notice.
And to add insult to injury, you deliver a significant portion of the remaining profits to yourself as "incentive compensation," followed by buybacks of stock to offset the dilution, which investors actually cheer because they don't realize they've been taken for suckers.
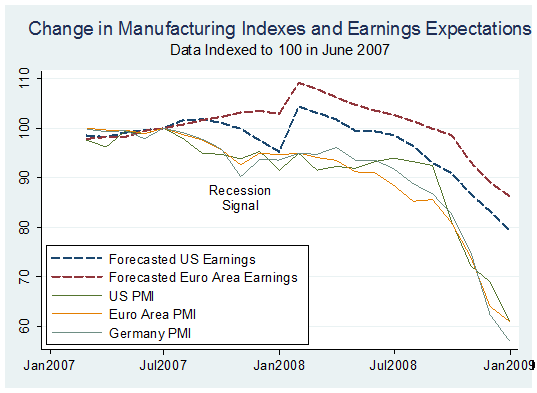
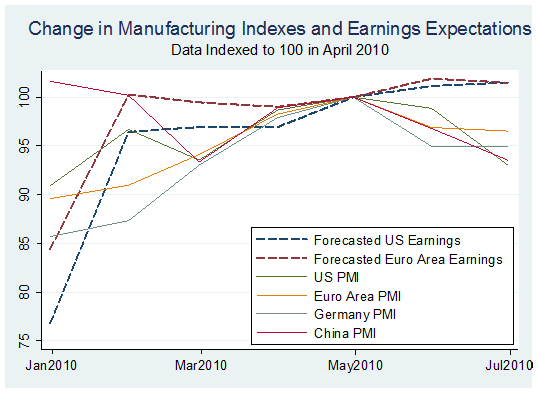
The graph below attempts to contrast the erosion in the global PMI indexes against the rising optimism of stock analysts.
Six series of data are plotted: the changes in earnings expected for the companies in the S&P 500 and the Euro Stoxx Index, and four PMI indexes for the US, the Euro area, Germany, and China. Each of the series is indexed to 100 in April, the month where most of the PMI data peaked.
As for all of 2010, the consensus is at $82 operating EPS, and for a new record to be reached in 2011, at $96 — breaking the record of $88 three years ago. Good luck in seeing a further 30% increase in profits with nominal GDP rising at a 3.0-4.0% annual rate at best in the next six quarters and at a time when margins are already back to cycle peaks.
For the full John Hussman archive visit the blogroll.....
Für eine komplette Auflistung der gesammelten Werke von Joghn Hussman bitte Blogroll beachten.....
Quite refreshing compared to the usual "Buy, Buy, Buy...." spin ( UPDATE: After todays market action worth a second look) that is flooding the wires these days..... Excellent takes on banks, debt, inflation/deflation, GOLD, the upcoming jobs report, the real economy etc.....You can read his note "Uber Bear Early Warning Alert" they are refering to here & his even more bearish update "Prepare for flash crash II and $10 trillion of QE"here.....This guy makes even me look like a bull.... ;-)
In diesem Interview werden alle relevanten Themen ( Banken, Inflation/Deflation, Arbeitsmarkt, reale Wirtschaft, GOLD, Verschuldung ... ) ziemlich schonungslos und meiner Meinung nach sehr treffend abgehandelt....Vergleicht diese Ansichten mit der "Buy, Buy, Buy....Mentalität" ( UPDATE: Ist speziell nach dem heutigem Handelstag einen "zweiten Blick" wert ) die ansonsten tagtäglich von Wall Street Finest gepredigt wird.... Wer möchte kann den "Uber Bear Early Warning Alert" auf dem im Interview Bezug genommen wird hier nachlesen oder sein noch negativeres Update "Prepare for flash crash II and $10 trillion of QE" hier zu Gemüte führen...... Im Vergleich dazu höre selbst ich mich bullish an.....
I think balance sheets and sustainability - govt, central bank ANDprivate sector, MATTER
If they no longer matter, I will be WRONG, and I will have to accept that the policy of ‘Print/Borrow/Spend on Rubbish we don’t Need’ is a limitless phenomena, without consequences, which means there should never be a bear marketever again….
Well I clearly underestimated the ability & willingness of the Public Sector, notably in the UK, US, parts of periph Europe and Japan, to take huge risks with their sovereign balance sheets, AND IMPORTANTLY, I over-estimated the ability & willingness of the Financial Sector/Market to see things for what they are (Another Debt Fuelled Bubble/Ponzi).
We are trapped in some horrendous Keynesian/monetarist nightmare, where policymakers, aided/abetted/advised by their buddies in the media, in the lobbyist cabal and in financial system, have YET AGAIN decided to go down the route which merely delays the problem/pushes it down the road, but which virtually guarantees that when the NEXT bubble collapses (I assume it will be the Global Government Debt/Bond Bubble and/or the Global Fiat Money/Paper Money/FX Bubble), there is NO pleasant way back.
With All The "Surprising" Sovereign Debt Worries Popping Up .....
It´s probably not a bad time for another posting on GOLD.... Especially when more & more people are realizing that not only bank balance sheets have something in common with Charles Ponzi, Madoff or Enron .... For investors outside the US it is not insignificant to highlight that it is not the $ price per ounce that matters.......In Germany it is almost impossible to find the € price per ounce in the media....Even in the so called "business" papers & channels...... The history of my earlier GOLD related postings gives a hint why i think that at least a "few" percentage of every portfolio should include GOLD ....
Nachdem ja momentan die Welt "plötzlich" gemerkt hat das neben den Bankenbilanzen praktisch alle relevanten Staatshaushalte zumindest in nicht unwesentlichen Teilen etwas mit Charles Ponzi, Madoff & Enron zu tun haben, ist es mal wieder Zeit für ein Posting in Sachen GOLD..... Zudem kann es nicht schaden wenn man nochmal gesondert darauf hinweist das für alle nicht US Investoren der $ Preis je Unze irrelevant ist ist...... Leider ist es z.B. in Deutschland fast unmöglich den € Preis je Unze in den gängigen Medien zu erhaschen.... Gilt im übrigen auch für die sog. "Fachpresse" ...... ;-) Ein Blick in meine "gesammelten Werke" zum Thema Gold dürfte erklären warum ich es nicht verkehrt finde, wenn zumindest ein "kleiner" Prozentsatz des Portfolios aus Gold besteht.....
As someone who has been a close observer of bubbles for the past ten years the data does not recommend that conclusion. And what makes me even more curious about this point of view is that the very people who for the most part denied the existence of the obvious bubbles in tech, housing, risk, banking and credit, even to the point of absurdity, who could not or would not see a bubble if it perched on the end of their nose, who are card carrying members of the international monied fraternity, are the most vocal in calling gold a bubble with emotional arguments lacking any fundamental data.
Emerging market central banks (EM CB) are ever more aware that gold is really one of the few viable alternatives to the USD. Top holders of currency reserves like China, Russia or India will likely need to increase their exposure to gold over the coming months and years as the value of fiat currency reserve holdings like the USD or the EUR comes into question. The obvious problem with diversification is that there is simply not enough gold to go around. So a deterioration of Greece’s creditworthiness, even if negative for the EUR, should be supportive of gold prices in the long run, in our view.
click on image for a sharper view / auf Grafik für schärfere Version klicken
Somewhat "irritating" that suddenly even Wall Street banks are not bashing GOLD on a daily basis..... Bank of America is getting exited that some EM central banks will diversify their holdings ....I wonder if they view a diversfication of private holdings into GOLD a "Black Swan" event....After watching BofA drawing all the right conclusions they "ignore" that the same diversification effect would be true for every non central bank investor....The percentage of GOLD related investments vs Assets Under Management makes even the Chinese exposure look like "excessive"..... ;-) For more related links visit the comments Irgendwie "ungewohnt" das plötzlich selbst Wall Street Banken nicht mehr tagtäglich Goldbashing betreiben....Bank of America führt als Argument an das die Zentralbanken in den EM Ihr Goldbestände aufstocken werden. Ich für meinen Teil denke das neben den Zentralbanken vor allem die Privaten als Käufer auftreten werden.......Selbst in dieser Matrix wird diese Möglichkeit bestenfalls ansatzweise gestreift ( obwohl die richtigen Schlußfolgeriungen getroffen werden ).. Wenn man sich das Verhältnis von Gold zu den verwalteten Vermögen ansieht erscheint selbst der Goldanteil China´s als eine starke Übergewichtung..... ;-) Mehr zum Thema gibt es in den Kommentaren....
The high quality of the GDP aka "Government Domestic Product" growth is indeed "impressive".... As a GOLDBUG you gotta love this kind of "sustainable" growth.....
Solch "solides" und vor allem "nachhaltig" erkauftes GDP bzw "Government Domestic Product" Wachstum verdeutlichen eindrucksvoll warum ich starker Befürworter von GOLD bin..... ;-)
Americans rejoice! GDP grew by 3.5% in the third quarter and the recession is over.
It’s time to drink champagne, dance in the streets, and have a group hug with Nancy Pelosi and Ben Bernanke. But whatever you do, don’t ask yourself why the recession has ended. The answer might ruin the party.
The recession is over only because Washington decided it should be. With billions in fresh government spending, it was only a matter of time before GDP posted some growth.
It’s too bad all that government spending is borrowed money. Someday, we’ll actually have to pay off this year’s $1.4 trillion deficit.
Of course, all of the president’s Keynesian men will argue that everything is working to plan — the stimulus is stimulating. But it’s hard not to see today’s GDP bounce as a bit of a sham.
Just check out where the economy grew. Almost half — or 1.7% of the pickup in GDP growth came from “motor vehicle output.” That’s the summer’s $3 billion cash-for-clunkers program doing its thing.
Edmunds.com just released some compelling analysis on cash-for-clunkers. Apparently, it cost the U.S. taxpayer about $24,000 per vehicle sold. Edmunds gets that number by dividing the $3 billion by the 125,000 additional car sales generated by the program. The methodology makes sense to me, but click here and decide for yourself.
The White House would probably contend that it’s impossible to determine incremental sales — meaning each sale that only happened because of the government $3,500 to $4,500 subsidy. And that the sale of each and every car spurs economic activity well beyond the program’s $3 billion.
But isn’t it possible that the Edmunds.com analysis is actually understating the true costs to the taxpayer? What about the interest costs on the borrowed $3 billion?
What about the cost of propping up GMAC so that it could underwrite cash-for-clunker loans?
That’s the catch with all this government intervention — lots of unforeseen consequences. And we never learn. The trillion dollar disasters with Fannie Mae and Freddie Mac haven’t stopped the government from tinkering with the housing market.
Consider another one of Washington’s smashing successes: the $8,000 credit for first-time home buyers.
For the third quarter, “real residential fixed investment” — also known as “homebuilding” — jumped 23.4%. That boosted GDP by another 0.5%. Do you feel like hugging Harry Reid now?
> Mehr Häuser.....Macht bei Ansicht der o.g. Grafik die das Verhältnis von neuen Hausverkäufen und neuen Zwangsvollstreckungen extrem viel Sinn..... Besonders wenn man bedenkt das in den USA lediglich 18.8 Million leerstehende Häuser existieren ...... Brauche nicht zu erwähnen das diese mehr als sinnvolle Förderung gerade ausgedehnt und verlängert worden ist......
But we’re not seeing the real cost of the homebuyer tax credit. This is very expensive stuff. The Calculated Risk blog figures the home-buyer credit costs the taxpayer $43,000 per incremental home sale. Goldman Sachs ran its own numbers, reckoning that each incremental home sale cost the taxpayer an astounding $80,000. Again, the methodology seems right to me, but decide for yourself.
Government purchases were surprisingly strong. Instead of falling back from what had looked an erratic 14.0% annualised rise in Q2, defence spending increased further, at an 8.4% rate.
Personal income decreased $15.5 billion (0.5 percent), while real disposable personal income decreased 3.4 percent, in contrast to an increase of 3.8 percent last quarter. Those are horrible numbers
The savings rate is down, which no doubt has misguided economists cheering, but people spending more than they make is one of the things that got us into trouble.
The government sloshed trillions around and yet disposable income is down, jobs are horrendously weak, and the only reason GDP rose is wasteful government spending, cash-for-clunkers and extremely unaffordable housing tax credits whose effect is soon going to start diminishing even though the program was just extended.
I see plenty of chances for negative territory or at least extremely anemic growth starting in the second quarter of 2010, if indeed not the first quarter.Let's see what Christmas brings.
I am expecting far weaker numbers than most. In the meantime, let's party even if only for a day or two. Reality is likely to return soon.
This suggests that all the growth in Q3 was due to the stimulus package, and the impact will now wane - only 2% in Q4, and 1.5% in Q1 2010 - and then the package will be a drag on the economy in the 2nd half of 2010.
Turns out coursing a few gigavolts of financial stimulus current through even an economy the size of the U.S. will still get Frankenstein off the slab, however briefly.
> Why i´m not surprised that the bubblehead from CNBC brouht up all the "Cash On The Sidelines"...... UPDATE: What a difference a day makes.... The same guys laughing at Rosenberg & spinning the cash on the sidelines, strong gdp, markets moving higher etc have reversed course and are suffering severe AMNESIA.....Click here for BUBBLEVISION at its best.....
> Passend zur euphoriuschen GDP Stimmung verwundert es nicht das der Typ von CNBC das Totschlagargument "Cash On The Sidelines" ins Spiel gebracht hat...... UPDATE: Was für ein Unterschied doch 24 Stunden machen können.... Dieselben "Gestalten" die noch gestern Rosenberg "belächelt" haben und was von Cash on the sidelines, starkes GDP, etc gefaselt haben leiden unter akutem Gedächnisverlust und haben Ihre Meinung um 180% gedreht....Hier klicken um zu erfahren warum CNBC als Bubblevision geadelt worden ist....
From the latest Rosenberg report
U.S. Q3 REAL GDP — ABSOLUTELY NOTHING TO GET EXCITED ABOUT
Never before did a gap between a 3.2% consensus GDP forecast and an actual print of 3.5% manage to elicit so much excitement in the equity market. It just goes to show how speculative the stock market has become. The question is why it is that the economy couldn’t do even better?
Historically, the auto sector adds 0.1 percentage point or 0.2 percentage point to any given GDP report. In the third quarter, courtesy of cash-for-clunkers, the sector added 1.7 percentage points to the headline figure, which is less a than 1-in-10 event in terms of probabilities.
Because of the housing and auto subsidies, the personal savings rate plunged to 3.3% in Q3 from 4.9% in Q2 — in the past quarter-century, there have been only four other times that the savings rate went down so much in one quarter.
If not for that plunge in savings, real GDP actually would have contracted fractionally last quarter. The entire GDP growth was funded by a rundown in the savings rate that occurs less than 5% of the time.
Moreover, what is normal in that first positive post-recession GDP release is a 5% annual rate of growth. That puts 3.5% in Q3 into a certain perspective, especially when you consider the massive amount of stimulus that underpinned the latest batch of data.
While it seems very flashy, 3.5% growth is far from a trend-setter. Let’s go back to Japan. Since 1990, it has enjoyed no fewer than 19 of these 3.5%-or-better GDP growth quarters.
That is almost 25% of the time, by the way.
And we know with hindsight that this was noise around the fundamental downtrend because the Japanese economy has experienced four recessions and the equity market is down more than 70% from the peak
Without "Cash for Kindles, I-Phones, trucks etc" 2010 will be very "interesting".... Thank god the "experts" still argue the stock market is discounting the obviously bright outlook for the coming years....How else would you justify one of the biggest stock market rallies of all time ( chart ) ...... Would be shocking to see the "Herd" get it wrong ......... ;-)
Ohne "Cash for I Phones, LKW´s usw. " dürfte das Jahr 2010 mehr als interessant werden.... Zum Glück schauen die Märkte ja wie uns regelmäßig erzählt wird voraus und haben die "exzellenten" Aussichten für die nächsten Jahre sicher eingepreist.... Wie anders ist einer der gewaltigsten Aktienmarktrallies aller Zeiten ( Chart ) auch sonst zu erklären.....Wäre ja auch das erste Mal das die "Herde" komplett daneben liegen würde, oder ? ;-) Fuzzy Numbers Chris Martenson
As assumed last Friday the Dow finally hit 10 K. After looking at the chart you probably know why i prefer gold....... I think a few years from now this ratio will be even more favourable.....Wouldn´t surprise me if we see similar ratios like in 1980 . The same is true when you price the S&P 500 in Gold .....
Wie bereits letzten Freitag hat der Dow die 10 K geknackt. Habe das mal zum Anlaß genommen das Dow/Gold upzudaten. Unschwer zu erkennen warum ich seit langer Zeit Gold bevorzuge.... Meiner Meinung nach wird sich dieses Verhältnis zukünftig noch weiter zugunsten von Gold beschleunigen.... Ich würde selbst ein Verhältnis ähnlich dem Jahr 1980 für nicht "unwahrscheinlich" halten. Ähnlich verhält es sich wenn man den S&P 500 in Gold kalkuliert .....
Team coverage today on Bloomberg by the Money Honeys as the Dow Jones Industrial Average crossed 10,000 intra-day, led by J.P. Morgan, in a move that surely epitomizes the illusions of wealth granted by modern accounting practices.
Can you believe the NYSE had the nerve to prepare new Dow 10,000 hats and distribute them for today? The first time the Dow Industrials crossed 10,000 was in 1999. The last time it closed over 10,000 was in October of 2008, just before the most recent plunge of the collapsing credit bubble.
That does not speak well of equities for the "buy and hold" crowd, which has surely had a wild ride if they have indeed managed to hold on for the last ten years, and ex-dividends and fees and commissions and inflation and a plunging US dollar and soaring commodities are... even.
AMEN :-)
UPDATE:
The following videos are too good to be buried in the comment section..... Judging from this interview Bloomberg has morphed into another version of CNBC.......
Denke die folgenden Clips sind zu gut um in den Kommentaren versteckt zu werden..... Muß gestehen das ich nach dem folgenden Interview den Eindruck habe das sich Blommberg und CNBC nicht mehr wesentlich voneinander unterscheiden......
Thank God There Is No Conflict Of Interest....... ;-)
Nothing really new but with the Dow probably hitting 10.000 on Monday i think it´s not a bad time to update the topic "Wall Street Finest" ....... Watch the red line......
Da der Dow wahrscheinlich am Montag die 10.000 knacken wird und auch ansonsten alle Märkte weltweit nahe Ihren Hochs stehen kann es nicht schaden erneut einen Blick die selbstverständlich "höchst wertvolle" Rolle der sog. Experten , oder wie von mir liebevoll als"Wall Street Finest" tituliert, zu werfen..... Man beachte die rote Linie....
In October 2008, as the global financial system teetered on the brink of collapse, “sell” calls in U.S. markets constituted 6 percent of the total recommendations by analysts, with “buys” comprising 36 percent and “holds,” 58 percent, according to Bloomberg data.
Almost a year later, amid a stock market rally, the percentage of “buy” calls dropped: They made up 32 percent, with “holds” comprising 63 percent and “sells,” 5 percent, as of Oct. 8.
"Business as usual" ( across all segments ).....Now compare this kind of "wisdom" with the next report on valuations......
"Business As Usual" ( und das über alle Sektoren) ..... Vergleicht bitte die o.g. "Weisheit" mit dem folgenden Report zum Thema Bewertungen......
Even if one uses "operating earnings" a euphemism for "blatant lie" in which all "one-time losses" that recur like clockwork are ignored (along with everything else the companies want to ignore), the PE based clocks in at 29.64 as of the end of the third quarter according to S&P Earnings Data.
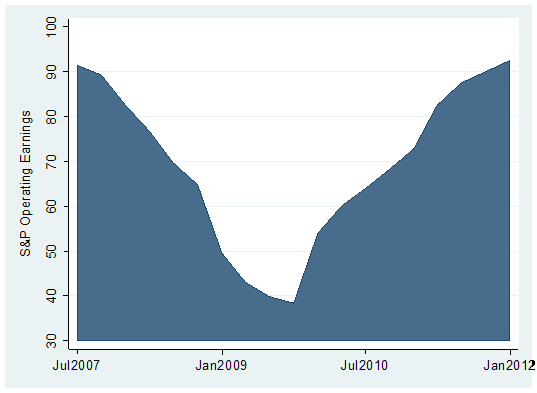
At these levels it seems that a full-blown V-shaped recovery is being priced in. There's no better example of a V-shaped forecast than for what is expected for the recovery in earnings over the next couple of years. The graph below shows the operating profit series, which includes actual results from the second quarter of 2007 – when earnings peaked – through this year's second quarter, and then continues with estimates through the end of 2011.
For operating earnings to get back to their peak levels, analysts have penciled in earnings growth of more than 40 percent over the next year, and then another 22 percent between 2010 and 2011
What is worth highlighting is that analysts expect that the typical company will soon achieve the same level of profit margin that they were able to deliver in the years leading up to 2007 – a period where leverage was preferred over balance sheet strength, a preference by company managements to focus on equity shareholders, during a political climate where labor lacked bargaining power, where consumer spending was fueled by mortgage equity withdrawals, and leverage ratios increased broadly because business and consumer credit was easy to come by.
To assume a return to peak profit margins is a bet that the economic and political landscape that emerges over the next year or two will match the pre-panic landscape perfectly.
But it is also important to keep this from Barry Ritholtz & Hester in mind......
In jedem Fall sollte man aber diesen Kernsatz von Barry Ritholtz & Hester im Hinterkopf haben.....
Barry: As noted previously, at times, things like “valuation” or the economy or earnings don’t matter — until they suddenly do.
Hester : While S&P earnings may not be able to rise to the lofty expectations of analysts over the next couple of years, this isn't a strongly bearish argument in itself. The link between near-term earnings and stock direction is tenuous. Outside of very large changes in earnings, there is essentially no correlation between year-over-year changes in earnings and changes in stock prices.
But if you're investor that is sensitive to valuation and your preference is to use forward earnings, then an understanding of the building blocks that create those earnings estimates is important.
Regardless of this rule the risk/reward ratio isn´t quite "favourable" ( i´m being polite ) right now...... But as long as the technicals are not breaking down it is still too dangerous to entry a short position...... Even if it is very tempting.... ;-) At least the first not insignificant signs are popping up that the party might be over rather sooner than later......At some point this kind of "wealth transfer" has to stop...... I´m pretty sure this guy will have lots of fun in 2010...... ;-)
Denke es bleibt in jedem Fall festzuhalten das das momentan vorhandene Chance/Risikoverhältnis nicht gerade vorteilhaft ( höflich vormuliert ) ist...... Solange die Markttechnik aber noch intakt ist sollte man auf jeden Fall der Versuchung widerstehen short zu gehen. Auch wenn das tagtäglich schwerer fällt...... ;-) Immerhin sind doch erste ernsthafte Anzeichen zu erkennen die andeuten das der Party bald der Treibstoff ausgeht.......Spätestens wenn diese Art von "Umverteilung notgedrungen Ihr Ende findet......Ich bin mir ziemlich sicher das dieser Typ spätestens im Jahr 2010 eine Menge Spaß haben wird...... ;-)
This quote from James Bianco sums it up ( when it comes to stocks )..... More "Anti Spin" on this topic from Barry Ritholtz, Hussman & Tim Bond
Der nachfolgende Satz von James Bianco trifft es hervorragend ( zumindest wenn es im Hinblick auf Aktien gemacht wird ) .......Mehr "Anti Spin" zu diesem Thema von Barry Ritholtz, Hussman & Tim Bond
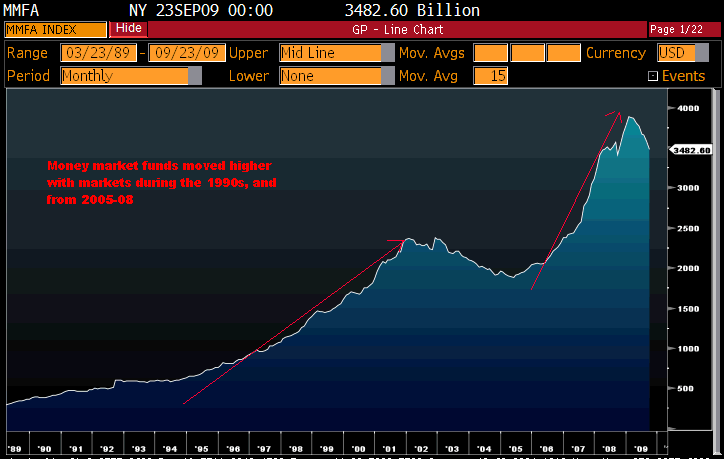
“Any time you hear a money manager say there’s $3.5 trillion dollars in cash on the sidelines, take your money away from them. Because he doesn’t know what he’s saying.”
Will “Cash-on-the-Sidelines” Really Drive Stocks? MarketBeat WSJ The “cash-on-the-sidelines” argument many market-watchers make to explain why stocks should move still higher shows no signs of losing traction.
MarketBeat: Jim, thanks for taking a few minutes to talk. You recently wrote a research piece saying the assets in money-market mutual funds won’t be moving into stocks anytime soon. How come?
Bianco: If you look at the mutual-fund flows there is a record amount going into bond funds. Forty-two billion dollars went into bond funds in August, which is an all-time monthly record. In fact, the all-time monthly record, I believe, for stock funds was $55 billion back in February of 2000. So it’s pretty close to the stock-fund record. But when you break it down, what you’ll find is that short-term muni funds, and short-term corporate funds, those are the funds that are getting huge, huge inflows. The short-term corporate funds are up 12% this year. And as we talk right now, the S&P 500 is up around 16% this year and the Dow is up about 11% this year. That’s including dividends. So my conclusion was, “Yes, there’s a lot of money that’s built up in the cash on the sidelines. Yes, it is going to come out of that zero interest rate funds. And its going into short-term bond funds, which by the way are performing pretty much in line with the stock market. So don’t hold your breath. You’re going to be waiting a long time before you see that money ever matriculate into the stock market.”
MarketBeat: What about the cash-on-the-sidelines argument more broadly. Do you have problems with the fundamental logic of it?
Bianco: Now a couple things about that. The first one is I hate when they say, “There’s $3.5 trillion on the sidelines and that’s a whole lot of money.” It implies that all of that money should be put in investments like the stock market. That’s not true. The vast, vast majority is in transactional balances.
MarketBeat: What does that mean exactly?
Bianco: It’s money that is going to be needed in a very short period of time, like, within a year. It’s going to be spent on something. They’re almost like checking accounts, if you want to think of it that way. It’s like somebody saying, “You’ve got $10,000 dollars in your checking account, why don’t you $10,000 worth of stocks?” And the answer is, “Well because I’ve got to pay my credit card bill and my rent.”
Maybe $1,500, $2,000 or $1,000 of it, I might be able to peel out and put into an investment. But I can’t put the whole $10,000 into it.
MarketBeat: So who owns all this money in money-market funds?
Bianco: The way people say “$3.5 trillion in money-market funds,” they make it sound like $3.5 trillion of widows and orphans are out there irrationally taking a zero-percent return and not recognizing that they should be plowing their money into the stock market.
Well, first of all 65-70% of the money isn’t widows and orphans. It’s institutional money, and the majority of it is transactional balances. So once you stripped all of that out, how much retail money is hiding away from the stock market? The answer is, it’s not very much. It’s probably in the range of a couple of hundred billion dollars.
So there’s a few hundred billion dollars — not $3.5 trillion — that could potentially move back into a longer term investment. My argument is that most of it is already moving. It is moving into short-term bond funds. And those short term bond funds have performed in line with the stock market.
So, what you would need is a massive divergence of those short-term bond funds underperforming — with the stock market not going down — in order to start pushing people out the risk curve even more and into stocks.
So when people say, “Look at all this money. it’s an all-time high in money market funds. And these people are stupid for being in money funds.” Well, money funds have outperformed the stock market for the last 12 years. So shouldn’t money funds have a lot of assets relative to stocks right now? Because we all know that everybody chases performance. So the fact of the matter is there should be a lot of money there because stocks have not performed well. The high-falutin’ technical term for that is “stocks have sucked.”
“Well, they’ve been outperforming cash since March,” would be the argument. Yes, but not over the last two years. People do remember what the stock market did to them last year.
MarketBeat: So, in short you don’t buy the cash-on-the-sidelines argument.
Bianco: No. You know I started in this business in 1986 and there was a ton of cash on the sidelines. And every single day since 1986 everybody has told me that there’s large amounts of cash on the sidelines.
MarketBeat: What do you mean?
Bianco: That’s been a constant argument that’s never gone away. There’s never been a point where anybody has argued that there’s been too little cash on the sidelines. That’s just background noise is all that argument is. Especially when somebody says there’s $3.5 trillion on the sidelines. I was kidding around with some guys in the office here and said, “Any time you hear a money manager say there’s $3.5 trillion dollars in cash on the sidelines, take your money away from them. Because he doesn’t know what he’s saying.”
Equity managers want you to believe that in reality there should be no such thing as a money-market fund. And they should all be closed down and all that money should be put into the stock market.
UPDATE: Quote Rosenberg
"Another way to look at the situation is that when you hear and read about "liquidity" driving the market, it is usually a catch-all phrase for "we have no clue" but it sounds good. "
News from 1930 Daily summary based upon my reading of the Wall Street Journal from the corresponding day in 1930
There's a large amount of money on sidelines waiting for investment opportunities; this should be felt in market when “cheerful sentiment is more firmly intrenched.”
Probably no coincidence that two of the brightest like GOLD ( both with different views if & when inflation will become a problem )........... Excellent read!
Sicher kein Zufall das zwei der Besten Gold nicht abgeneigt entgegen stehen. Und das obwohl die Zwei weit ( Untertreibung ) auseinander liegen ob & wann Inflation problematisch werden könnte..... Extrem empfehlenswert! Klickt bitte jeweils den Toggle Button oben rechts und nutzt dann die Zoomfunktion für das perfekte Format.
Here are his thoughts on today´s rally. For a daily dose of excellent "ANTI SPIN" i highly recommend to subsribe to the free daily update from David Rosenberg.
Hier seine Gedanken zum heutigen Kursfeuerwerk. Wer die momentan wohl beste tagtägliche Analyse frei aus geliefert haben möchte der sollte sich hier registrieren lassen.
Mark Faber Is Still Making A Lot Of Sense..... Enjoy!
One of my "favourites"...... After listening to the interview or visiting my earlier post on Faber you know why.... ;-) Einer meiner absoluten "Favoriten"...... Spätestens nachdem Ihr das Interview bzw meine früheren Posts zu Faber gesehen habt wisst Ihr warum..... ;-)
While i agree with several of Faber´s viewpoints i´m "less optimistic" on the markets than Faber ( see here & here ) and will finish with a quote from yesterdays post....
Obwohl ich mit fast allen was Faber zum Besten gibt übereinstimme bin ich im Vergleich doch "weniger optimistisch" im Hinblick auf die Märkte ( siehe here & here )und kann mir nicht verkneifen ein gestriges Zitat erneut zu wiederholen
I think balance sheets and sustainability - govt, central bank AND private sector, MATTER
If they no longer matter, I will be WRONG, and I will have to accept that the policy of ‘Print/Borrow/Spend on Rubbish we don’t Need’ is a limitless phenomena, without consequences, which means there should never be a bear market ever again….
I hope this sounds as ridiculous to you reading as it did to me when writing…..
Some very interesting charts & observations from William Hester. As i´ve written earlier i´m very sceptical ( quite an understatement ) regarding the health of the recent market rally..... I´ve added the latest from Rosenberg via Zero Hedge & another Chart via WSJ
Einige sehr aufschlußreiche Charts & Bemerkungen von William Hester. Wie bereits früher geschrieben bin ich extrem skeptisch ( leichte Untertreibung ) was die Verfassung der Märkte angeht. Ich habe zusätzlich noch was vom Rosenberg ( via Zero Hedge ) sowie dem WSJ hinzugefügt.
Is it the private client? Not really — stock funds actually had net outflows of $1.33 billion last week, while bond funds enjoyed an $8.2 billion net inflow.
Is it corporate insiders? Well, heck no — Robert Toll (CEO of Toll Brothers) just disclosed that he sold a total 1.6 million shares of his company’s stock yesterday.
UPDATE via Hulbert: They are selling a whole lot more of their companies' stock than they are buying. The net difference is even larger than it was two months ago, when I noted that insiders were already selling at a greater pace than at any time since the top of the bull market in the fall of 2007
For the week ended last Friday, according to Vickers, insiders sold 6.31 shares for every one than they bought. The comparable ratio two months ago was 4.16-to-1, and at the March lows the ratio was 0.34-to-1.
Is it buybacks? Not at all — in fact, S&P 500 companies bought back a mere $24.4 billion on stock repurchases in 2Q, down 72% from a year ago and the lowest in recorded history, according to Howard Silverblatt of Standard & Poor’s. ( great Chart via Floyd Norris )
So who’s doing the buying? Very likely it is still a combination of program trading, short coverings and portfolio managers desperately trying to make up for last year’s epic losses.
The most notable characteristic of a durable stock-market advance, which failed to appear in the recent advance, is a strong expansion of trading volume. When you adjust the trading volume data for a handful of mostly lower-quality financial stocks, the picture gets worse.
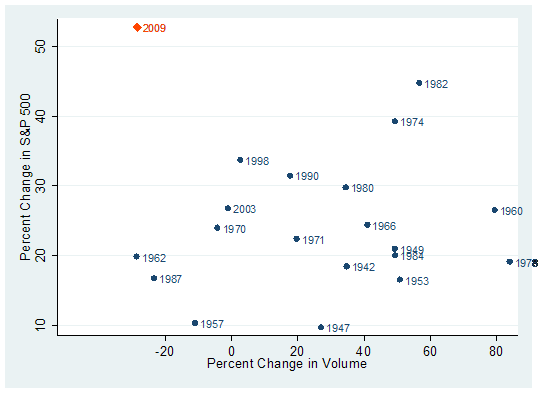
I noted in Trading Volume Separates Bull Markets from Bear Rallies that bull markets have typically begun on strong volume after selling had become exhausted. As Richard Russell has said - “volume should always be studied as a trend relative to what has preceded it”. The chart below updates one of the graphs for the elapsed time from that earlier piece. The vertical axis measures the six-month percent change in the S&P 500 from the bottom of each bear market going back to the early 1940's. The horizontal axis shows the percent change in volume over that same period.
Familiar durable bear-market bottoms stand out, like in 1982 and 1974. These rallies had strong returns that coincided with large bursts of trading volume during the first six months of the rally. There are a couple of examples, like 1998 and 2003, where bull markets had a good start on mediocre expansions in volume. But for the most part, in the cases where volume contracted the bull market beginnings have been uninspiring. More common is a strong increase in volume that coincides with gains of 20 to 25 percent during the first six months.
It's clear that this year's rally is an extreme outlier in the dataset, with above-average returns and a continued contraction in volume from the levels of trading in March.
Even so, some analysts have become optimistic because volume trends first leveled off, and then have risen marginally over the last few weeks.
But almost the entire rise in volume during the last month and half has come from a handful of stocks. Examples include Fannie Mae, Freddie Mac, Citigroup, AIG, and Bank of America
These are just five. There are a couple of other stocks that are interchangeable with these companies and would produce similar results – but the characteristic they all share is that they are financial stocks that only recently were on the brink of collapse. And since the Government's rescue of these and other financial firms, the group has risen up from the ashes. For ease of reference, we'll call these Phoenix stocks.
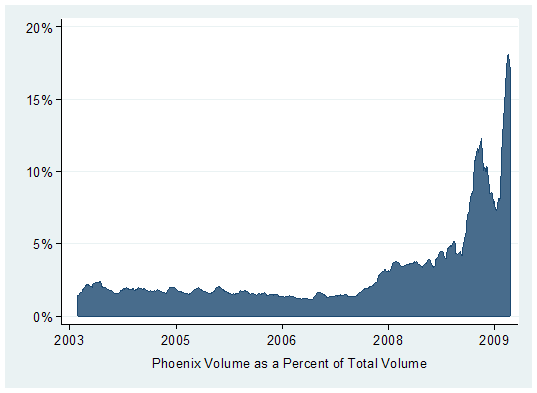
The rise in trading volumes in some of these stocks has been considerable. The shares of AIG now often trade with 15 times the volume they traded a year ago. Citigroup has traded at 12 times the amount from a year ago. This helps explain why the trades in these companies' shares are taking up a larger fraction of total share volume. The graph below shows the trading volume in the Phoenix stocks as a percent of total NYSE share volume since 2003. You can see that the trend of rising volumes in relation to total volume began during 2008, when volumes rose as the market capitalizations of these companies shares fell. Off of this year's March low, Phoenix volumes as a percent of total volume rose above 5 percent for the first time and then fell off slightly in June and July.
During the last six weeks, the trading in these stocks as a percent of total volume has jumped to almost of fifth of share trading.
Commentators and analysts have offered up a few explanations for the heavy trading in these shares – short covering, the focus of day traders, and institutional trend following programs. Each of those explanations is probably doing their part. Outside of highlighting the casino-like atmosphere that has gripped parts of the stock market, the amount of trading in these shares is less important than the role this trading is playing in the overall volume figures.
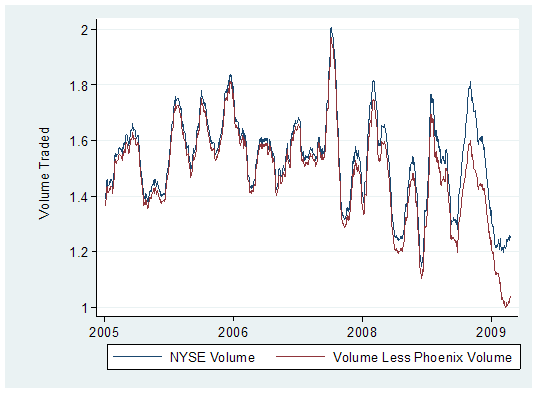
The graph below shows two measures of trading volume. The blue line is the daily share volume traded on the NYSE (smoothed). The red line is total volume less the volume traded in our group of Phoenix stocks. As the graph shows, during the last couple of years, the two lines have hardly parted. That's because the Phoenix trading volume was a small fraction of total volume. The recent divergence between the two highlights that volume outside of a handful of these financial stocks continues to contract.
On a Phoenix-volume adjusted basis, NYSE share trading is at the lowest level in years. Healthy bull markets, even if not during the earliest days of a rally, will typically recruit growing amounts of investor interest and expanding levels of volume as prices rise
Expanding volume continues to be an important characteristic missing from this rally.
If they no longer matter, I will be WRONG, and I will have to accept that the policy of ‘Print/Borrow/Spend on Rubbish we don’t Need’ is a limitless phenomena, without consequences, which means there should never be a bear market ever again….
I hope this sounds as ridiculous to you reading as it did to me when writing…..
This quote was just too good to be burried in the comment section...... ;-)
Dieses Zitat war einfach zu gut um es lediglich in den Comments zu posten.. ;-)
Demand, not only for gasoline, but for other major products markets as well, is going the wrong way, i.e. from the top left to the bottom right on the charts. Thus, Big Oil is straining under the weight of poor margins.
It is now hard to reconcile these earnings reports, demand was lousy in the second quarter (and it not any better today). Yet, this market was being fed a fantastic lie back then… the less bad is good mantra.
Thus, whereas spot crude oil on the NYMEX finished the first quarter just below $50 a barrel (49.66) it finished the second quarter just below $70 (69.89). Crude oil rallied 40 percent as profits at the world’s largest oil companies were tumbling.
Why?
Because this market wanted to ignore the obvious and lull itself to sleep with silly pseudo-intellectual catchphrases… green shoots, crocuses, mustard seeds and this season’s rookie of the year… the second derivative.
Thus, while we were led to believe that demand for oil was rising in the second quarter, hence the justification for that 40 percent surge on the NYMEX, we now have the balance sheets from Exxon, Shell et al. that prove it was a lie.
Look at the screenshot of headlines we pasted on the top of today’s report. Profits for Big Oil are down as demand is at generational lows.
However, look at the very first headline, the NYMEX was higher esterday because “… corporate earnings boost confidence…”
Huh?
According to this one article, demand for oil and therefore profits for oil companies are down, but the NYMEX rallied yesterday because Motorola (mobile phone maker) had a smaller than projected loss and Calphalon (cookware) and Paper Mate (writing instruments) had better than expected profits
.
You really cannot make this up......
Das ist so absurd das man sich unweigerlich fragt ob wir schon wieder den 1. April haben.... :-)
Thank god that real earnings don´t matter...until they matter.....It will be interesting to see how long the new mantra "Less Bad Is the New Good" can keep this market "elevated"( see Dow Sends Buy Signal That’s Worked Since 1921: Chart of the Day via Bloomberg , needless to say that i think this CHART OF THE DAY: Shades Of 1929is more realistic) ... This cartoon sums it up..... ;-)
Gottseidank wird ja den realen Gewinnen momentan keinerlei Bedeutung beigemessen und das alle Schätzungen auf den berühmt berüchtigten EBITDA bzw Proformabasis ( ex dieses, ex jenes, usw.) basieren......Ansonsten wäre das KGV ( wenn es denn überhaupt vorhanden wäre ) auch zu schockierend...... Dieses Beispiel ist leider keine Ausnahme..... Bin gespannt wie lange der Markt auf Basis "Less Bad Is the New Good" die Party am laufen halten kann ( hier eine weitere atemberaubende Einschätzung via Bloomberg Dow Sends Buy Signal That’s Worked Since 1921: Chart of the Day , ich tippe mal das diese Variante CHART OF THE DAY: Shades Of 1929 wahrscheinlicher ist) ....Denke dieser Cartoon trifft es ziemlich gut...... ;-)
Today's chart provides some perspective on the current earnings environment by focusing on 12-month, as reported S&P 500 earnings. Today's chart llustrates how earnings are expected (38% of S&P 500 companies have reported for Q2 2009) to have declined over 98% since peaking in Q3 2007, making this by far the largest decline on record (the data goes back to 1936).
In fact, real earnings have dropped to a record low and if current estimates hold, Q3 2009 will see the first 12-month period during which S&P 500 earnings are negative.
Some still call the market "cheap"...... No problem with the right pro forma ( What are pro forma earnings? ) model/formular.... Havn´t heard the word GAAP for a long time....;-)
Gut zu wissen das einige der Experten den Markt immer noch als "billig" betiteln..... Wenn man die richtige "Proformakalkulation" (siehe What are pro forma earnings? ) zugrunde legt sicher kein Problem.... Ich jedenfalls wundere mich schon lange nicht mehr das ich den Gewinnausweis nach der einheitlichen Bilanzierungsvorschrift GAAP nur nach lagem suchen im Kleingedruckten der Quartalsberichte finden kann..... Vor alternativen Analysten und Unternehmenskreationen wie EBITDA ( oftmal noch versüßt durch andere "außerordentliche" Belastungen ) usw. kann man sich in der tagtäglichen Berichterstattung hingegen kaum retten.....;-)
Another day, another big house predicting further gains for stock markets.
Joining Goldman Squid, Credit Suisse and HSBC, Nomura sees a further upside of 13% for global equities in the second half of the year
In fact this is fast becoming the new equity market consensus. Goldman, for example, is now targeting 1,060 on the S&P 500 by the year-end, on account of better-than-expected results, particularly from the financial sector, while Credit Suisse is looking for 1,050 citing earnings revisions and cash balances and HSBC expects 1,020 because the earnings downgrade cycle is coming to an end.
Here’s how the argument goes, according to a note fired off by Nomura’s Ian Scott to clients on Monday.
second quarter results beat expectations by a wide margin......
the market remains cheap and should have rallied further......
Secondly, we would argue that the market is valued for downgrades to analysts’ forecasts, not upgrades.
With a 12-month forward multiple of 14.1, 17% below the 20-year average multiple.
> I especially like "should have rallied further"...... I highly recommend the "rant" from Michael Panzner on another uber bullish "expert"......
> Finde besonders den Hinweis großartig das die Aktien bisher kaum auf die tollen Ergebnisse reagiert haben und hätten eigentlich viel weiter laufen müssen...... Empfehle in diesem Zusammenhang den weniger euphorischen Blick von Michael Panzner......
And here is the projected earnings growth rate over the next two quarters, needed to justify the rosy perspective on the economy: the bottom line: over 110% in projected EPS growth in 6 months. A jobless, revenueless doubling in earnings!
> As i´ve said before "with the right pro-forma model".......
> Wie bereits gesagt, wenn man nur genügend "außerordentliche" Posten herausrechnet ist ne Menge "möglich"..... Ein paar Beispiele folgen dank des zeitlich hervorragend passenden nachfolgenden Link.... Analog genügt natürlich ein Blick in jede xbeliebige AD-HOC.... ;-)
July 30 (Bloomberg) -- At a time when the financial industry’s credibility is at an all-time low, you would think Wall Street’s finest would break their necks providing transparency.
Not so. Stock analysts continue to promote corporate earnings lies, insisting that net income isn’t really what investors need to know.
Instead, their earnings estimates ignore often huge expenditures that can’t help but affect a company’s health.
In analystspeak, Intel Corp. wasn’t hit with a $1.45 billion fine from the European Union in the second quarter for anticompetitive practices.
After setting aside funds to cover the fine, which Intel is appealing, the semiconductor-maker had a quarterly loss of $398 million, or 7 cents a share. Disregarding the fine altogether, analysts maintain the company earned 18 cents a share, beating their average estimate of 8 cents.
As Wall Street tells it, the employee stock options Google Inc. granted in the second quarter didn’t cost its shareholders $293 million.
Google, according to generally accepted accounting principles, earned $1.48 billion, or $4.66 a share, in the period. Not enough for Wall Street, which prefers to say the company earned $5.36 a share, leaving out the cost of stock options.
Business journalists know what’s going on ( jmf: really? I have some serious doubts ....?) and in their stories emphasize net income -- which accounting authorities say is where the focus should be. Still, if reporters want to show how the latest report compares with earnings estimates, they are stuck using analysts’ predictions. ...
Viacom Inc., an entertainment company, this week reported second-quarter net income of $277 million, or 46 cents a share. Analysts had estimated profit as if money Viacom paid out in severance in the period wasn’t the real thing. On that basis, Viacom earned 49 cents a share, beating the average estimate by 1 cent.
Time Warner Inc, a rival of Viacom for entertainment dollars, said it earned $519 million, or 43 cents a share, in the quarter. Analysts insist Time Warner earned 45 cents, excluding, according to Bloomberg data, costs related to litigation and asset sales. Lawyers must work for nothing.
By similar Wall Street reckoning, the expense of cutting jobs and selling an asset that reduced McGraw-Hill Cos. second quarter earnings per share by 10 percent was immaterial.
Analysts also say investors should ignore $129 million that Textron Inc., maker of small airplanes, helicopters and golf carts, charged against net income in the latest quarter. Included was the cost of shutting a plant for an eight-seat jet Textron decided not to build.
General Electric Co., which makes jet engines and electric power equipment and has a financial services arm, had a second- quarter profit of 24 cents a share. GE and the analysts emphasized earnings from continuing operations, which at 26 cents a share, exceeded their estimate by 2 cents. A $194 million loss from discarded businesses was discarded.
Wall Street’s big earnings lies must exasperate investors. They already have lost faith in the reported earnings of banks that are the center of the financial system.
The argument is that “adjusted” earnings make for a smoother picture of company performance.
Cooking the books to smooth out earnings from quarter to quarter is what hoodwinked shareholders of Fannie Mae and Freddie Mac several years ago.







![[bear markets and stocks]](http://s.wsj.net/public/resources/images/MI-AY840A_ABREA_NS_20090920221439.gif)
![[cartoon+spin+bull+vs+bear.jpg]](https://blogger.googleusercontent.com/img/b/R29vZ2xl/AVvXsEiuPQMKH6tt2SyTJB3yPOYZ-X9YC3bj84NQzztoONINFz-SOnqa-U_CiYMbPoMbElu85J0bqA7GKqUqRJAHQuGr2pEbast9ECpBPvezHBwW15g3pg2b5dkdXedzXX5uniucjXCn6A/s1600/cartoon+spin+bull+vs+bear.jpg)


 > As i´ve said before "with the right pro-forma model".......
![[Most Recent Quotes from www.kitco.com]](http://www.kitconet.com/charts/metals/gold/t24_au_en_usoz_2.gif)
![[Most Recent Quotes from www.kitco.com]](http://www.kitconet.com/charts/metals/gold/t24_au_en_euoz_2.gif)