CME Housing Futures Update
dank geht an http://tickersense.typepad.com/ticker_sense/

Labels: cme, ticker sense
Gold...The Ultimate Triple-A Asset

Labels: cme, ticker sense
 dank geht an tweedle-dee und ben http://thehousingbubbleblog.com/?p=1910#comments
U.S. Credit Perspectives / Credit Innovation and Opportunities http://tinyurl.com/y3ljk8
.....financial market innovation has shifted the status quo for individuals and corporations. Thanks to new products in the mortgage and credit markets, homebuyers and corporations can access capital like never before. And with the global economy growing and default rates at historically low levels, investors have been ready and willing to provide that capital.
However, with innovation comes risk. Uncharted waters have not yet been tested during turbulent times. If the U.S. economy slows sharply, today’s healthy risk appetites could quickly wither. Most likely, a deceleration in the economy will diminish the availability of capital, increase volatility, and apply downward pressure on asset prices by raising risk premiums in credit markets from today’s historically low levels.
Innovations in the Mortgage Market
Innovations in the mortgage industry have made it easier than ever for homebuyers to acquire real estate. The home ownership rate in the United States today is at 69%, up 5% in the last 10 years ....mortgage industry’s ability to develop new products that keep initial monthly payments low, enabling consumers to buy homes they could not otherwise afford,(yes they can not afford this kind of houses!)....... Last year, ARMs represented 31.4% of total mortgage originations whereas in 2001 ARMs contributed only 10.2%1. Other examples of new mortgage products include mortgages with maturities up to 40 years, low or no down payments, reverse mortgages, and introductory teaser-rates. Creative financing kept housing accessible despite rising short-term interest rates.
....... Consequently, due to innovation, disintermediation and leverage, housing prices have appreciated significantly faster than nominal GDP growth over the past several years 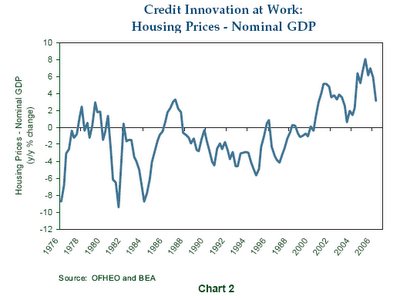
Ironically, despite a significant slowdown in housing price appreciation and soaring inventories2, credit availability for home buyers is only just beginning to tighten. Why? Investors remain focused on low default rates. In addition, abundant global liquidity continues to flow into the credit markets.....
Nevertheless, innovations in the mortgage market have brought a new and growing class of buyers, including sub-prime, adjustable-rate, and speculative borrowers, into the housing market. In all likelihood, these new players contributed to the rapid appreciation in the housing market over the past several years. However, if delinquencies and foreclosures rise, the prevalence of these marginal players will probably reduce risk tolerances. How the cooling housing market will impact the overall economy is still unclear.
What does seem clear to us is that the tightening of credit for homebuyers we are beginning to see is just that: the beginning. If we are correct, it follows that the influence of leverage and innovation on the housing market will turn and asset prices will be challenged.
Innovations in the Credit Market
As new mortgage products transformed credit availability for homebuyers, credit market innovations have also influenced corporate bond spreads. Credit default swaps (CDS) have grown such that the notional value of all outstanding CDS is now three times larger than the cash corporate bond market (Chart 3). As a result of growing liquidity in the CDS market, corporate bond collateralized debt obligations (CDOs) are increasingly replaced by synthetic CDOs, which are funded with CDS contracts as opposed to cash bonds. ....... Placated by historically low default rates, investors are now comfortable taking on more structured credit risk......

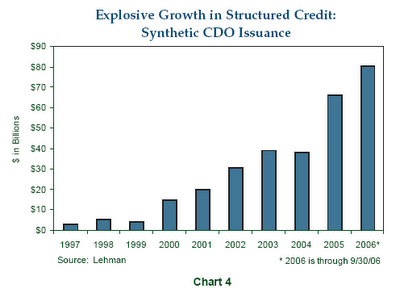 Does credit innovation carry risks? Yes. As we have seen with housing, new home buyers can be lured into buying homes they cannot afford. Ultimately, rising defaults and restricted credit availability will negatively affect the housing market, foreshadowing what is also in store for the credit market. ......... These products (cds, cdo´s, cpdo´s....) and markets are relatively new and, more importantly, have yet to be tested in a bear market. Leverage has been pushed to the point that corporate bonds, and particularly CDS securities, may have limited upside potential going forward. In fact, the explosive growth in leveraged structured credit products globally is likely a main catalyst behind the dramatic tightening in the major U.S. and European credit default indices (CDX and iTraxx) where credit spreads have now reached new tights (Chart 5). We are clearly in uncharted waters.

rest is tied to their tradingstrategies of bonds and derivatives........
Labels: derivatives, lbo, pimco, stresstest
Labels: greenberg



Labels: land rush, palm springs

U.S. July, Aug., Sept. new-home sales revised lower (total 64.000)
U.S. new-home sales down 25.4% year-on-year
U.S. Oct. new-home inventory falls 0.7%, 7-month
that is without counting the cancellations .......http://tinyurl.com/uvoul
U.S. Oct. new-home median price up 2% y-o-y to $248, 500 (back out incentives and its a different picture..)
U.S. Oct. new-home sales fall 3.2% to 1.004 mln pace
Sales fell in three of four regions. They dropped 39 percent in the Northeast, 5.6 percent in the Midwest and 1.7 percent in the South. They rose 3.2 percent in the West. 
update
make sure you see all the graphs from calculated risk! http://calculatedrisk.blogspot.com/2006/11/october-new-home-sales-1004-million.html, http://calculatedrisk.blogspot.com/2006/11/more-on-october-new-home-sales.html
paper money http://paper-money.blogspot.com/2006/11/new-home-sales-collapse.html
Labels: new home sales
 Chief Executive Officer Chip Hornsby said he's begun a ``significant'' savings program after U.S. operating profit declined in the three months to Oct. 31. Headcount at North Carolina-based building-materials unit Stock has been cut by 10 percent to 18,000. Other U.S. divisions fared better, with earnings at plumbing business Ferguson increasing 20 percent.
Labels: double whammy, layoffs
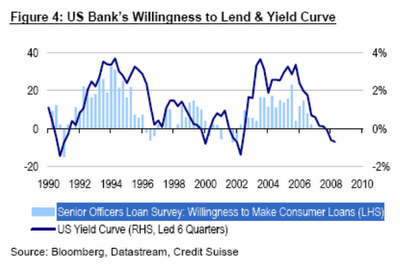
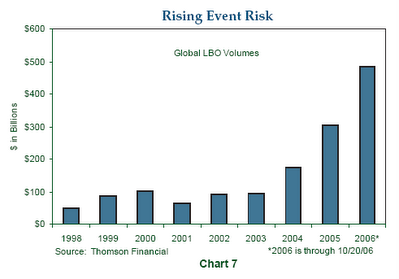
Labels: indicator, lbo, private equity, willingness to lend

paper money http://paper-money.blogspot.com/2006/11/briskly-eroding-home-prices-yield.html with good region to region summary
calculated risk http://calculatedrisk.blogspot.com/2006/11/nar-sales-up-inventory-up.html with great charts
mish http://globaleconomicanalysis.blogspot.com/2006/11/catch-22.html with mike morgan!
housingdoom http://housingdoom.com/2006/11/28/national-median-home-prices-down-35-year-over-year/#more-325 with a good graph
Labels: existing home sales


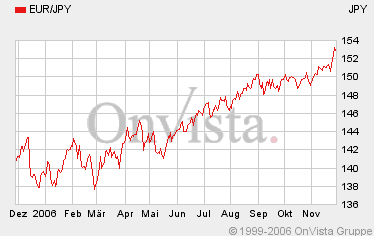
looks like the strong $ policy isn´t working for the us (domestic+overseas)......
sieht so aus als wenn die "politik des starken $" wirkung zeigt (sowohl in der heimat als auch im ausland).........
disclosure: short $, long gold, goldbugs
Labels: us$ index
the S&P 500 has yet to record a 1% one-day decline, and the streak now sits at 75 trading days. The chart below shows that the current streak is now the longest of the bull market and also the longest since way back in 1995
now add almost the whole november to this and you see the magnitude of this run. / nun noch den fast kompletten november dazuaddieren und man sieht wie gewaltig die bewegung war.
until yesterday! it really was about time........ / bis gestern. es wurde aber auc zeit.
no surprise that just last week the investor optimism was the highflying....../ kein überraschung das ausgerechnet letzte woche der anlegeroptimismus neue rekorde erreicht .. .... http://immobilienblasen.blogspot.com/2006/11/lot-of-room-for-disappointments.html
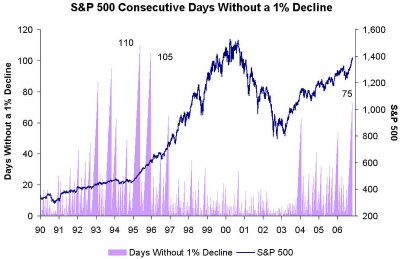 größer/bigger http://tickersense.typepad.com/photos/uncategorized/1declines1.jpg
Labels: investor sentiment, sp500

dank geht an http://www.housepricecrash.co.uk/
http://tinyurl.com/yk4acp Mortgage debt in Ireland is increasing at almost three times the EU average and Irish people owe twice as much on their mortgages as their European counterparts, according to new research.
The European Mortgage Federation (EMF), which represents EU lenders, found that mortgage debt in Ireland increased by 28.5 per cent last year, compared to an EU average of 10.7 per cent.
Only Greece and eastern European countries such as the Czech Republic, Estonia, Latvia and Lithuania had higher mortgage debt growth rates than Ireland.
The average amount owed on a mortgage in Ireland per head of population is €24,082, compared to an EU average of €11,184, according to the EMF.The Irish figure was the third highest amount owed in the EU, with only Danish and Dutch people owing more.
Ten years ago, the average Irish person owed just €3,830 on their mortgage. The EMF said that house price growth in Ireland ''outperforms other EU countries'', with house prices increasing by more than 400 per cent between 1991 and 2005 - twice the EU average.
Labels: bubble world tour, ireland
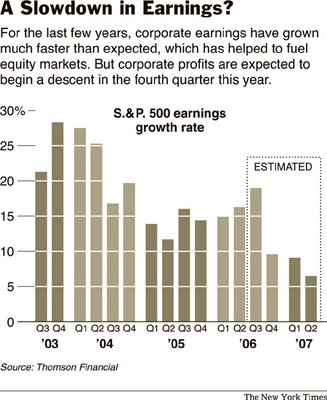
remember when you see this kind of data that a lot of the eps growth comes in the form of (often) debt fueled buybacks. the earningsquality isn´t always as good as wall street wants to make us believe.
bedenkt bitte bei betrachtung dieser grafiken das ein großer teil dieser gewinnzuwächse auf (oft) schuldenfinanzierten aktienrückkäufen basiert. die gewinnqualität ist also nicht immer so gut und schön wie wall street gerne unterstellt.
Labels: investor sentiment, pe
 As it happens, the simple, normalized earnings yield on the S&P 500 has been a remarkably good indicator of subsequent 20-year total returns for the stock market. In the chart below, I take the inverse of the price/peak-earnings ratio as a “normalized” earnings yield. Recall also that peaks in S&P 500 earnings over the past century have been well contained by a 6% annual growth trendline. (Finding that level today is easy. To quote Madge in the Palmolive commercial; “you're soaking in it”). In order to further normalize the earnings yield, I've added the amount of annualized earnings growth that would be required to bring the prevailing peak-earnings figure earnings at any point in time up to that 6% growth trend.
I should add that it would be reasonable to expect the relationship between normalized earnings yields and subsequent market returns to have been affected by variations in the proportion of earnings retained and reinvested, the average rate of return on invested assets, and so forth. Evidently, these variations have not mattered much over the long-term. One might at least expect interest rate fluctuations to have mattered, but remember that a 10-year bond has a duration of just 7-9 years depending on its yield, while the duration of the stock market can fluctuate between just 16 years when yields are very high, to about 60 years (as is presently the case) when yields are very low. Over a 20-year horizon, which is usually about 3-4 complete bull-bear cycles, shorter cyclical variations in interest rates simply wash out.
Suffice it to say that if Graham's emphasis on normalized earnings yields has anything to say about the market here, it is that stocks are priced to deliver very disappointing long-term returns, regardless of short-term speculative (and even cyclical) influences...........
....Graham's investment criteria largely focused on tangible assets, demonstrated (though normalized) earning power, and so forth, with as few assumptions as possible about the future. I can't imagine that he would have looked enthusiastically on the market's current willingness to place a historically rich multiple on record earnings based on record profit margins.........
i wanted to put this chart from one of few german fellows that see the market the way i see it "wörnie" / danke! he is also a fan of hussman.
especially the 2nd. chart that shows the trendline of the earnings is clearly extendet.
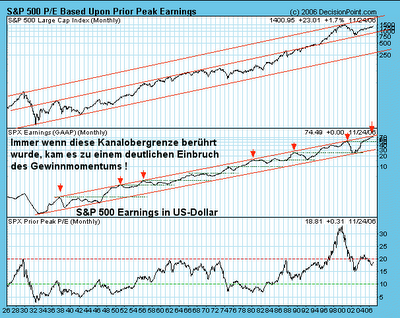
größer/bigger http://img153.imageshack.us/img153/922/uwagner3nz4.gif
Ich habe hier im Tröd mehrfach daruf hingewiesen, dass die Gewinne der S&P 500 Firmen langfristig, das heisst über einen Zeitraum von deutlich mehr als 100 Jahren mit im jahresdurchschnit 6 % gewachsen sind. ( Quelle J.Hussman) Die letzten Jahre war dieses Wachstum weit überdurchschnittlich ! Es ist jetzt natürlich nicht zwingend von einem Gewinneinbruch auszugehen. Aber ein weiter anziehendes Gewinnwachstum setzt natürlich entsprechende wirtschaftliche bzw. konjunkturelle Rahmenbedingungen voraus, die so nicht gegeben zu sein scheinen. Ziemlich wahrscheinlich wird sich das Gewinnwachstum irgendwann in naher Zukunft zumindest wieder dem langjährigen Durchschnitt annähern. (Reversion to the mean) Allein der Verlauf des 'Gewinnkanals' zeigt eine erhöhte Wahrscheinlichkeit für ein sich abschwächendes Gewinnmomentum. Wenn der Gewinnrückgang wie häufig in der Vergangenheit, bis auf oder in die Nähe des vorausgegangene Gewinnmaximums läuft, wären wir mit einem SPX Gewinn von sagen wir 52 USD (SPX Earnings 2000) bei heutigen Kursen bei einem KGV von 28. Das ist jetzt natürlich auch 'Spinnerei' bzw. im Nebel stochern. Aber mindestens so wahrscheinlich wie die bullische Unterstellung weiter steigender Gewinn bei sich gleichzeitig abschwächender Konjunktur
Labels: charts, hussman, peak earnings

Labels: hotelinvestments, private equity
 http://www.economist.com/finance/displaystory.cfm?story_id=8326784
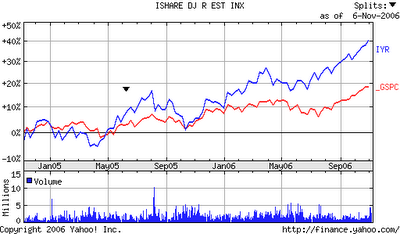
 the above cahrt is from am must read about reits from mike larsonhttp://www.moneyandmarkets.com/press.asp?rls_id=433&cat_id=6
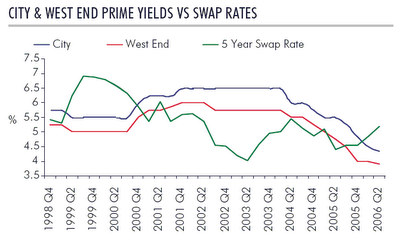
Labels: cartoon, lbo, private equity, reits
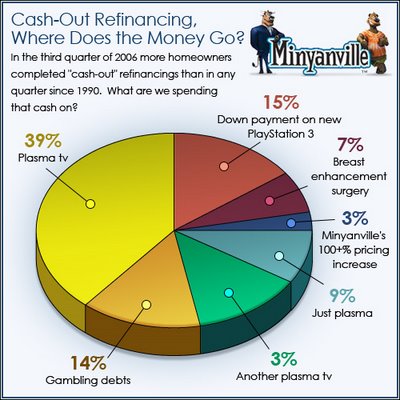
Labels: :-), minyanville, satire
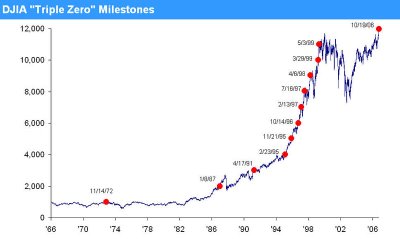
größer/bigger http://tinyurl.com/yy8a84
dank geht an https://www.chartoftheday.com/
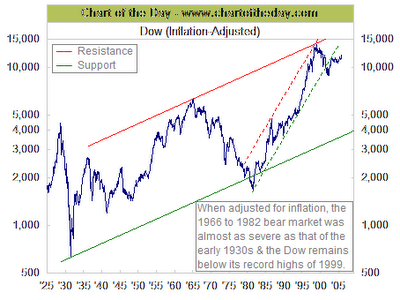
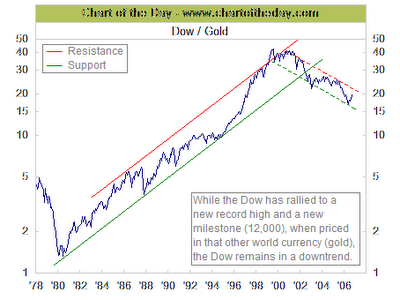
For some long-term perspective, today's chart illustrates the Dow adjusted for inflation since 1925. There are several points of interest. For one, when adjusted for inflation, the bear market that concluded in the early 1980s was almost as severe as the one that concluded in the early 1930s.

Labels: dow vs. gold, dow vs. inflation
der markt testet heute zudem die extrem wichtige markierung der 10 jahresbonds bei 4,54/4,55 http://immobilienblasen.blogspot.com/2006/11/bottom-in-10-year-treasuries.html#links
dank geht an clive maund. more long term charts http://www.clivemaund.com/article.php?art_id=1212

größer/bigger http://www.clivemaund.com/charts/usd1year261106.gif
some of the problems are:



dieser chart zeigt eindrucksvoll wie wenig "angst" im markt z.zt. ist. die preise für absicherungsgeschäfte ist so niedrig wie noch nie. und das obwohl die news doch zunehmend schlchter werden und das spekulative element besonders im bereich der kreditfinanzierten lbo´s oder going ptivate zu sehen ist. kombiniert das mit den pronlemen im $ und dem möglichen austrocken und schlimmer noch umkehr im carrytrade und der vixstand macht nicht sonderlich viel sinn. http://immobilienblasen.blogspot.com/2006/11/boj-chief-has-yen-carry-concern-mother.html#links
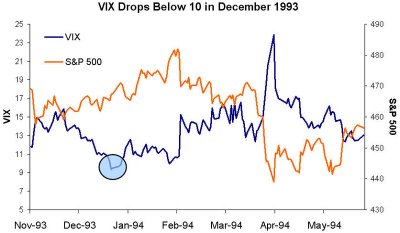
VIX Drops Below 10 dank an http://tickersense.typepad.com/ticker_sense/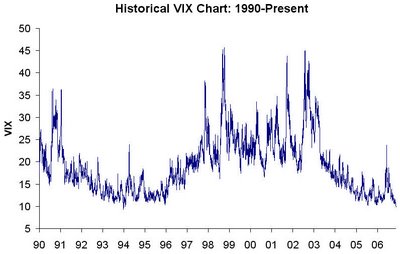
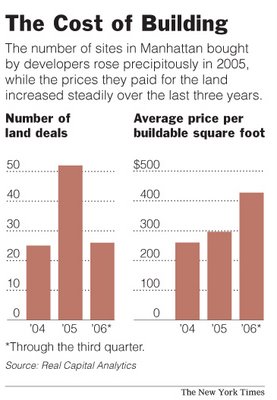
developers paid an average of $428 a square foot for sites to build on in Manhattan, far higher than the average of $297 a square foot they paid in 2005 or $260 a square foot in 2004. That means developers are going to have to add these high prices to increasing construction costs, making new projects much costlier over all.
In one case, Macklowe Properties paid $655 a square foot for the site of a combination hotel and condominium project at 53rd Street and Madison Avenue. That price doesn’t include construction costs or any other expenses associated with building. Now the developer has decided to put up an office tower instead (ouch!!!!, maybe blackrock will buy it......) http://immobilienblasen.blogspot.com/2006/11/reits-going-gaga-blackstone-to-buy.html
Labels: glut, ny, overbuilding

Labels: creditquality, fitb, mbs
 größer/bigger http://www.raymondjames.com/images/inv_strat/inv_strat_061120_1lrg.gif
 größer/bigger http://www.raymondjames.com/images/inv_strat/inv_strat_061120_2lrg.gif
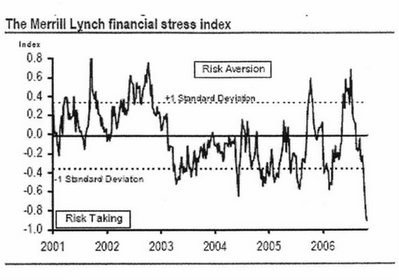
Consequently, we find ourselves left with a George Soros quote from the year 2000 – “Maybe I don’t understand the market, but I prefer not to have the same kind of continued exposure I’ve had up until now. In some ways I think the music has stopped only most people are still dancing.” (what a great quote!)
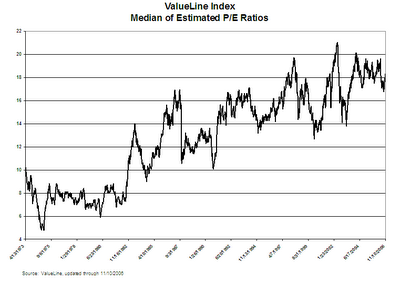
Labels: pe, risk aversion, risk taking, saut, valueline