Lessons from Ben Graham / hussman
immer gut sich die grundlagen von buffets lehrer und vorbild ins gedächnis zu rufen. gerade in diesen zeiten..
http://www.hussmanfunds.com/wmc/wmc061127.htm
..... Among his (grahams) key measures of investment merit included a market price near or below tangible net asset value, and a wide spread between normalized, fully-diluted earnings yields and high-grade bond yields. That spread between earnings yields and corporate bond yields had originally been enormous in the early part of the 20th century, and gradually eroded to nothing by the mid-1980's. Indeed, at this point, Wall Street analysts hasten to accept any excess earnings yield over-and-above the 10-year Treasury yield, even on the basis of “forward operating earnings” as the earmark of a cheap market. Graham would be appalled.
 As it happens, the simple, normalized earnings yield on the S&P 500 has been a remarkably good indicator of subsequent 20-year total returns for the stock market. In the chart below, I take the inverse of the price/peak-earnings ratio as a “normalized” earnings yield. Recall also that peaks in S&P 500 earnings over the past century have been well contained by a 6% annual growth trendline. (Finding that level today is easy. To quote Madge in the Palmolive commercial; “you're soaking in it”). In order to further normalize the earnings yield, I've added the amount of annualized earnings growth that would be required to bring the prevailing peak-earnings figure earnings at any point in time up to that 6% growth trend.
I should add that it would be reasonable to expect the relationship between normalized earnings yields and subsequent market returns to have been affected by variations in the proportion of earnings retained and reinvested, the average rate of return on invested assets, and so forth. Evidently, these variations have not mattered much over the long-term. One might at least expect interest rate fluctuations to have mattered, but remember that a 10-year bond has a duration of just 7-9 years depending on its yield, while the duration of the stock market can fluctuate between just 16 years when yields are very high, to about 60 years (as is presently the case) when yields are very low. Over a 20-year horizon, which is usually about 3-4 complete bull-bear cycles, shorter cyclical variations in interest rates simply wash out.
Suffice it to say that if Graham's emphasis on normalized earnings yields has anything to say about the market here, it is that stocks are priced to deliver very disappointing long-term returns, regardless of short-term speculative (and even cyclical) influences...........
....Graham's investment criteria largely focused on tangible assets, demonstrated (though normalized) earning power, and so forth, with as few assumptions as possible about the future. I can't imagine that he would have looked enthusiastically on the market's current willingness to place a historically rich multiple on record earnings based on record profit margins.........
i wanted to put this chart from one of few german fellows that see the market the way i see it "wörnie" / danke! he is also a fan of hussman.
especially the 2nd. chart that shows the trendline of the earnings is clearly extendet.
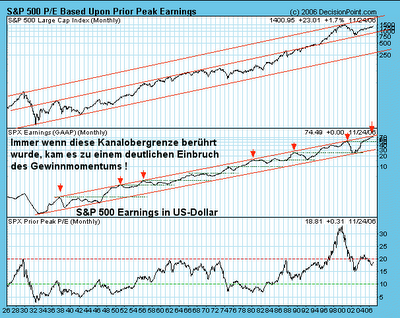
größer/bigger http://img153.imageshack.us/img153/922/uwagner3nz4.gif
Ich habe hier im Tröd mehrfach daruf hingewiesen, dass die Gewinne der S&P 500 Firmen langfristig, das heisst über einen Zeitraum von deutlich mehr als 100 Jahren mit im jahresdurchschnit 6 % gewachsen sind. ( Quelle J.Hussman) Die letzten Jahre war dieses Wachstum weit überdurchschnittlich ! Es ist jetzt natürlich nicht zwingend von einem Gewinneinbruch auszugehen. Aber ein weiter anziehendes Gewinnwachstum setzt natürlich entsprechende wirtschaftliche bzw. konjunkturelle Rahmenbedingungen voraus, die so nicht gegeben zu sein scheinen. Ziemlich wahrscheinlich wird sich das Gewinnwachstum irgendwann in naher Zukunft zumindest wieder dem langjährigen Durchschnitt annähern. (Reversion to the mean) Allein der Verlauf des 'Gewinnkanals' zeigt eine erhöhte Wahrscheinlichkeit für ein sich abschwächendes Gewinnmomentum. Wenn der Gewinnrückgang wie häufig in der Vergangenheit, bis auf oder in die Nähe des vorausgegangene Gewinnmaximums läuft, wären wir mit einem SPX Gewinn von sagen wir 52 USD (SPX Earnings 2000) bei heutigen Kursen bei einem KGV von 28. Das ist jetzt natürlich auch 'Spinnerei' bzw. im Nebel stochern. Aber mindestens so wahrscheinlich wie die bullische Unterstellung weiter steigender Gewinn bei sich gleichzeitig abschwächender Konjunktur
Labels: charts, hussman, peak earnings
posted by jmf at 11:01 PM
![]()
![]()
![[Most Recent Quotes from www.kitco.com]](http://www.kitconet.com/charts/metals/gold/t24_au_en_usoz_2.gif)
![[Most Recent Quotes from www.kitco.com]](http://www.kitconet.com/charts/metals/gold/t24_au_en_euoz_2.gif)


0 Comments:
Post a Comment
<< Home