Where Is The Volume......?
Einige sehr aufschlußreiche Charts & Bemerkungen von William Hester. Wie bereits früher geschrieben bin ich extrem skeptisch ( leichte Untertreibung ) was die Verfassung der Märkte angeht. Ich habe zusätzlich noch was vom Rosenberg ( via Zero Hedge ) sowie dem WSJ hinzugefügt.
A Bear Market Lurks as Dow Nears 10000 WSJ
![[bear markets and stocks]](http://s.wsj.net/public/resources/images/MI-AY840A_ABREA_NS_20090920221439.gif)
Rosie On Who The Market Buyers Are From this morning's Breakfast With Dave:
Without Phoenix Stocks, Volume Continues to Contract Wiliam Hester / HussmanIs it the private client? Not really — stock funds actually had net outflows of $1.33 billion last week, while bond funds enjoyed an $8.2 billion net inflow.
Is it corporate insiders? Well, heck no — Robert Toll (CEO of Toll Brothers) just disclosed that he sold a total 1.6 million shares of his company’s stock yesterday.UPDATE via Hulbert: They are selling a whole lot more of their companies' stock than they are buying. The net difference is even larger than it was two months ago, when I noted that insiders were already selling at a greater pace than at any time since the top of the bull market in the fall of 2007
For the week ended last Friday, according to Vickers, insiders sold 6.31 shares for every one than they bought. The comparable ratio two months ago was 4.16-to-1, and at the March lows the ratio was 0.34-to-1.
Is it buybacks? Not at all — in fact, S&P 500 companies bought back a mere $24.4 billion on stock repurchases in 2Q, down 72% from a year ago and the lowest in recorded history, according to Howard Silverblatt of Standard & Poor’s. ( great Chart via Floyd Norris )
So who’s doing the buying? Very likely it is still a combination of program trading, short coverings and portfolio managers desperately trying to make up for last year’s epic losses.
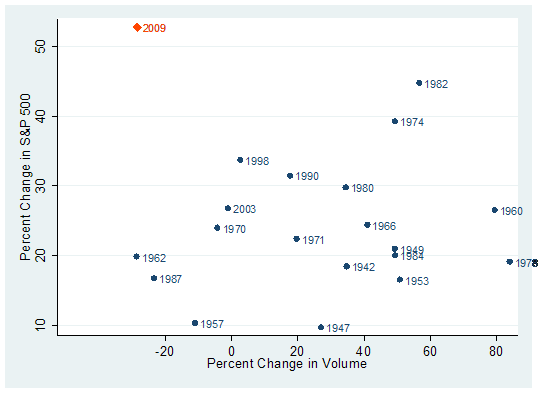
The most notable characteristic of a durable stock-market advance, which failed to appear in the recent advance, is a strong expansion of trading volume. When you adjust the trading volume data for a handful of mostly lower-quality financial stocks, the picture gets worse.I noted in Trading Volume Separates Bull Markets from Bear Rallies that bull markets have typically begun on strong volume after selling had become exhausted. As Richard Russell has said - “volume should always be studied as a trend relative to what has preceded it”. The chart below updates one of the graphs for the elapsed time from that earlier piece. The vertical axis measures the six-month percent change in the S&P 500 from the bottom of each bear market going back to the early 1940's. The horizontal axis shows the percent change in volume over that same period.

Familiar durable bear-market bottoms stand out, like in 1982 and 1974. These rallies had strong returns that coincided with large bursts of trading volume during the first six months of the rally. There are a couple of examples, like 1998 and 2003, where bull markets had a good start on mediocre expansions in volume. But for the most part, in the cases where volume contracted the bull market beginnings have been uninspiring. More common is a strong increase in volume that coincides with gains of 20 to 25 percent during the first six months.
It's clear that this year's rally is an extreme outlier in the dataset, with above-average returns and a continued contraction in volume from the levels of trading in March.Even so, some analysts have become optimistic because volume trends first leveled off, and then have risen marginally over the last few weeks.
But almost the entire rise in volume during the last month and half has come from a handful of stocks. Examples include Fannie Mae, Freddie Mac, Citigroup, AIG, and Bank of AmericaThese are just five. There are a couple of other stocks that are interchangeable with these companies and would produce similar results – but the characteristic they all share is that they are financial stocks that only recently were on the brink of collapse. And since the Government's rescue of these and other financial firms, the group has risen up from the ashes. For ease of reference, we'll call these Phoenix stocks.

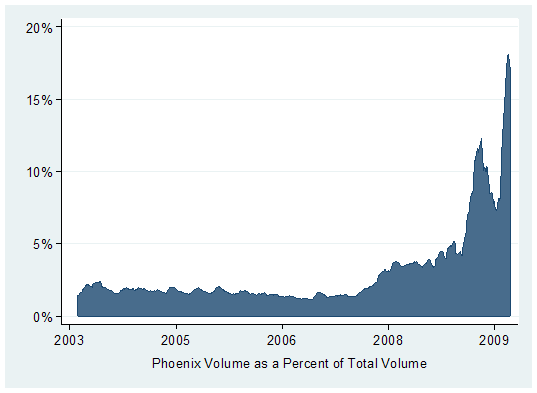
The rise in trading volumes in some of these stocks has been considerable. The shares of AIG now often trade with 15 times the volume they traded a year ago. Citigroup has traded at 12 times the amount from a year ago. This helps explain why the trades in these companies' shares are taking up a larger fraction of total share volume. The graph below shows the trading volume in the Phoenix stocks as a percent of total NYSE share volume since 2003. You can see that the trend of rising volumes in relation to total volume began during 2008, when volumes rose as the market capitalizations of these companies shares fell. Off of this year's March low, Phoenix volumes as a percent of total volume rose above 5 percent for the first time and then fell off slightly in June and July.
During the last six weeks, the trading in these stocks as a percent of total volume has jumped to almost of fifth of share trading.Commentators and analysts have offered up a few explanations for the heavy trading in these shares – short covering, the focus of day traders, and institutional trend following programs. Each of those explanations is probably doing their part. Outside of highlighting the casino-like atmosphere that has gripped parts of the stock market, the amount of trading in these shares is less important than the role this trading is playing in the overall volume figures.
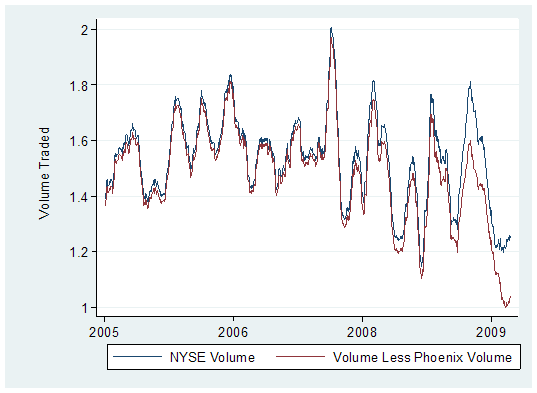
The graph below shows two measures of trading volume. The blue line is the daily share volume traded on the NYSE (smoothed). The red line is total volume less the volume traded in our group of Phoenix stocks. As the graph shows, during the last couple of years, the two lines have hardly parted. That's because the Phoenix trading volume was a small fraction of total volume. The recent divergence between the two highlights that volume outside of a handful of these financial stocks continues to contract.

On a Phoenix-volume adjusted basis, NYSE share trading is at the lowest level in years. Healthy bull markets, even if not during the earliest days of a rally, will typically recruit growing amounts of investor interest and expanding levels of volume as prices riseExpanding volume continues to be an important characteristic missing from this rally.
Update:
I think balance sheets and sustainability - govt, central bank AND private sector, MATTER Bob, ‘The Bear’, Janjuah via FT Alphaville
This quote was just too good to be burried in the comment section...... ;-)If they no longer matter, I will be WRONG, and I will have to accept that the policy of ‘Print/Borrow/Spend on Rubbish we don’t Need’ is a limitless phenomena, without consequences, which means there should never be a bear market ever again….
I hope this sounds as ridiculous to you reading as it did to me when writing…..
Dieses Zitat war einfach zu gut um es lediglich in den Comments zu posten.. ;-)
Labels: anti spin, balance sheet quality, bear market rallies, Bob ‘The Bear’ Janjuah, earnings quality, hester, insider sales, investor sentiment, rosenberg, sp 500
![[Most Recent Quotes from www.kitco.com]](http://www.kitconet.com/charts/metals/gold/t24_au_en_usoz_2.gif)
![[Most Recent Quotes from www.kitco.com]](http://www.kitconet.com/charts/metals/gold/t24_au_en_euoz_2.gif)

6 Comments:
It is always good to see CEOs investing in their companies' stock, especially if a firm is buying back shares. Alliance Data Systems has the buyback thing going. It has purchased $1.4 billion of stock since early 2008, reducing the share count by a third. But CEO Ed Heffernan is heading in the other direction. While he still has 244,000 unvested shares, he sold more than half of his vested stock last week for $3.1 million.
Of a total of 596 mutual funds in China, 51 have been launched since June 1, according to data from fund-tracking firm Morningstar.
Wall Street Finest At Their Best Marketbeat
AIG jumped roughly 11% today after the powerful House Oversight and Government Reform Committee confirmed receiving a proposal from former CEO Maurice “Hank” Greenberg to restructure the government’s bailout of the insurance giant
The reports prompted S&P Equity Research to boost AIG to “hold” from “sell.” “We see this news buoying the shares near term,” S&P’s Catherine Seifert wrote in quick squib earlier today. But before you sink the kid’s college fund into AIG shares, keep this in mind: It’s far from clear that there’s actually any actual equity value in this company. “We note June 30 tangible common equity was minus $261.66 per share,” Seifert states.
GREAT CALL :-)
Hi Jan-Martin,
I noticed massive correlation in the three exchanges on Google News Business' home page yesterday. I saved the picture here.
Not too much bad happening so far this morning, but I can't shake the feeling that we're Totally F****'d.
Moin John,
i also have the feeling that something is in the air.....
The herd mentality has caused big big problems in the past.... ;-)
Very difficult for me to stay disciplined to not short the market or certain sectors....
I think the market wants desperately to see DOW 10.000....
Wouldn´t surprise me if this will mark the top.....
Brit Bashes Bozos Jesse!
Post a Comment
<< Home