What a fascinating market and via FT Alphaville comes another good indicator of how "extreme" investor sentiment has become. Joshua Brown in Ladies and Gentlemen, We Are Trading On The Moon(!) has so far the best & funniest transcription of the latest market behavior....
As i have written in the past few days in Don´t Call It A Bubble.... & "Anti Spin" i´m a very sceptical ( more bearish than ever ) that this kind of market level is sustainable.... Especially in the face of a "spiking" Sovereign Misery Index .....To be honest i´m thinking this since October.... Make sure you watch the following clip.... Nice to see that Saluzzi still isn´t drinking the kool aid....
Bin jeden Tag aufs neue fasziniert wie der Markt auf die Nachrichtenlage reagiert. Meiner Meinung nach Joshua Brown in Ladies and Gentlemen, We Are Trading On The Moon(!) die bisher beste und lustigste Analyse zu Papier gebracht.
Ich bin wie in Don´t Call It A Bubble.... & "Anti Spin" geschrieben "skeptisch" ( höflich umschrieben ) was die Nachhaltigkeit der Kursanstiege angeht. Und all das im Angesicht eines täglich steigenden Sovereign Misery Index .....Meiner Meinung nach ist das Chance/Risikoprofil so unvorteilhaft wie selten....Die Skepsis steigt momentan tagtäglich und erreicht geradezu schwindelerregende Höhen.... ;-) Der nachfolgende Clip von Saluzzi liefert eine weitere gute Bestandsaufnahme in Sachen aktuelle Marktstimmung.....
Markets move on the interaction of news with flows of greed and fear among investors. When fear is lowest, the danger of a fall is greatest.
Especially when other sentiment indicators are considered:
Another great contrarian indicator is the survey of sentiment by the American Association of Individual Investors. Last week, this showed the lowest proportion of self-described “bears” since February 2007 – when volatility first started to spike as investors at last began to grasp the severity of the subprime mortgage crisis in the US.
Bearishness in this survey hit an all-time high in March last year when the current rally first started, showing how much money can be made by betting against extremes of sentiment.
But it’s not just the retail punter who’s bullish.
The Pros are too.
From Bloomberg:
Investors forecast gains in each of the nine countries represented in the Bloomberg Professional Confidence Survey for the first time since the data began in 2007.
The sentiment measure for the Standard & Poor’s 500 Index climbed 35 percent to 54.37. That’s only the second time the reading exceeded 50, signaling participants anticipate a rally in the next six months.
The responses from 4,101 Bloomberg users were gathered Jan. 4-8 as the MSCI World Index added 2.6 percent.
The Bloomberg sentiment indexes for the U.S., Japan and Spain rose above 50 and reached all-time highs.
The U.K. gauge topped 50 for the first time since October, while Switzerland climbed to a record.
Spain exceeded 50 for the first time, adding 17 percent to 51.41.
Confidence in Switzerland climbed 3.6 percent to 60.89, and the U.K. index surged 22 percent to 55.61. The measures for Italy, France and Germany increased 14 percent, 3.7 percent and 2.4 percent to 62.61, 57.77 and 53.33, respectively.
The latest survey showed the highest surge in Merrill’s Risk & Liquidity(46%) indicator since May of 2006. In the past, this indicator has served as a fairly good contrarian indicator.
This survey is showing some contrariansell signals. Just 45% of fund managers are protecting themselves against a downturn versus 52% in December. The survey also shows a strong appetite for risk and high beta names
The quotes along with the cartoon reflect pretty much my market outlook ...... Be very careful if you are long ( congratiolations to the courage ) this market...... I´m still sticking with my view that from a risk/reward perspective it makes no sense ( Goldman & BofA Merrill Lynch & JP Morgan & John Paulson beg to differ...... ) to invest ( long term exception Gold, short term it looks a little bit crowded ) in this market. Most Insiders ( Ratio 98:1 ) are also a lot more "cautious"......... And everybody pointing out to the "strong" jobs report on Friday as a sign that fundamentals are playing catch up with this "priced for v-shaped-perfection market" again should take a look at this amusing clip :-)
Die beiden Zitate zusammen mit dem Cartoon geben ziemlich genau meinen Marktausblick wieder.... Denke das jeder der momentan noch investiert ist ( Glückwunsch für den Mut ) sehr wachsam sein sollte...... Ich bleibe dabei das es bereits seit einiger Zeit unter Chance/Risikogesichtspunkten keinen Sinn ( Ausnahme langfristig Gold, kurzfristig sieht es allerdings etwas überhitzt aus ) mehr macht in diesen Märkten zu investieren ( Ganz im Gegenteil zu Goldman & BofA Merrill Lynch & JP Morgan & John Paulson .... ). Die Insider schließen sich bei einen es bei einem Verhältnis von 98 zu 1 eher meiner Meinung an.......Für alle die im Arbeitsmarktbericht vom Freitag die Wende zu besseren Fundamentaldaten erkannt haben wollen die dringenst benötigt werden um den bis zur perfekten V-Shaped Erholung bewerteten Markt auf ein noch steileres "V" zu treiben dem empfehle ich einen Blick auf diesen wirklich gelungenen Clip werfen ;-)
"Over the past decade, the stature of the market as an effective discounting mechanism has gradually eroded. The observation and analysis of potential risks – though essential to long-term investing and loss avoidance – is far less actionable than one might expect. Investors will evidently speculate as long they have dice in their hands and the casino is not visibly on fire."
"Banana Republic", "Disaster", "Reckless", "Unconstitutional Breach" ...... Uh ? When Hussman ( one of the best mangers out there > Performance Hussman 2000-2009 ) is using this kind of words it clearly qualifies for a rant..... Needless to say that i think he is spot on...... Just a few reasons why i´m long term bullish on Gold ( short term it looks a little bit crowded )....Along with Rosenberg, Faber one of my long time favourites......
Wenn ein ansonsten sehr besonnener und überaus erfolgreicher ( siehe Performance Hussman 2000-2009 ) Zeitgenosse wie Hussman zu solch drastischen Worten wie "Bananenrepublik", "Desaster", Verfassungswidrig" usw. greift sollte man aufhorchen..... Und das sind nur einige der gewichtigen Gründe warum ich langfristig bullisch für Gold bin ( kurzfristig sieht es allerdings etwas überhitzt aus ).... Wer meinen Blog etwas länger verfolgt weiß, das ich zu 100% übereinstimme.....
From a long-term perspective, my record is very comfortable. But clearly, I was wrong about the extent to which Wall Street would respond to the ebb-and-flow in the economic data – particularly the obvious and temporary lull in the mortgage reset schedule between March and November 2009 – and drive stocks to the point where they are not only overvalued again, but strikingly dependent on a sustained economic recovery and the achievement and maintenance of record profit margins in the years ahead.
I should have assumed that Wall Street's tendency toward reckless myopia – ingrained over the past decade – would return at the first sign of even temporary stability. The eagerness of investors to chase revailing trends, and their unwillingness to concern themselves with predictable longer-term risks, drove a successive series of speculative advances and crashes during the past decade – the dot-com bubble, the tech bubble, the mortgage bubble, the private-equity bubble, and the commodities bubble. And here we are again.
We face two possible states of the world. One is a world in which our economic problems are largely solved, profits are on the mend, and things will soon be back to normal, except for a lot of unemployed people whose fate is, let's face it, of no concern to Wall Street. The other is a world that has enjoyed a brief intermission prior to a terrific second act in which an even larger share of credit losses will be taken, and in which the range of policy choices will be more restricted because we've already issued more government liabilities than a banana republic, and will steeply debase our currency if we do it again. It is not at all clear that the recent data have removed any uncertainty as to which world we are in.
What I do think is that over the past decade, investors (including people who hold themselves out as investment professionals) have become far more susceptible to reckless myopia than I would have liked to believe. They have become speculators up to the point of disaster.
Frankly, I've come to believe that the markets are no longer reliable or sound discounting mechanisms.
The repeated cycle of bubbles and predictable crashes over the recent decade makes that clear. Rather, investors appear to respond to emerging risks no more than about three months ahead of time.
Worse, far too many analysts and strategists appear to discount the future only in the most pedestrian way, by taking year-ahead earnings estimates at face value, and mindlessly applying some arbitrary and historically inconsistent multiple to them.
Discounting the markets three month ahead of time..... ? This is probably only true when they are sniffing around for the next dose of QE or some kind of bailout, subsidy, stimulus etc ...But to do that you don´t need to be a rocket scientist... Washington & the Fed have a 100 percent track record in bailing out anything.....Unlike in Dubai ....;-) I think here is Hussman way too kind........
Vorwegnehmen ?. Denke das die Vergangenheit bewiesen hat das die Märkte und besonders Wall Street Finest hier keinesfall im Vorwege Probleme kommen sehen.... Die Fähigkeit etwas vorwegzunehmen trifft wohl am ehesten zu, wenn es darum geht den nächsten Bailout usw zu erahnen ( der kommt ja bekanntermaßen bestimmt ).... Hier kommt zwischenzeitlich mal wieder der "alte" höfliche Hussman durch.... ;-)
In part, the market's increasing propensity toward speculation reflects the increasing lack of fiscal and monetary discipline from our leaders. Policy makers who seek quick fixes and could care less about long-term consequences undoubtedly encourage investors to embrace the same value system.
Paul Volcker was the last Fed Chairman to have any sense that discipline and the acceptance of temporary discomfort was good for the nation.
In my estimation, there is still close to an 80% probability (Bayes' Rule) that a second market plunge and economic downturn will unfold during the coming year. This is not certainty, but the evidence that we've observed in the equity market, labor market, and credit markets to-date is simply much more consistent with the recent advance being a component of a more drawn-out and painful deleveraging cycle.
As Gluskin Sheff chief economist David Rosenberg noted last week, “Even if the recession is over, the historical record shows that downturns induced by asset deflation and credit contraction are different than a garden-variety recession induced by Fed tightening and excessive manufacturing inventories since the former typically induce a secular shift in behavior and attitudes towards debt, asset allocation, avings, discretionary spending and homeownership. The latter fades more quickly.
“This is why people didn't figure out that it was the Great Depression until two years after the worst point in the crisis in the 1930s; and why it took decades, not months, quarters or even years, for the complete transition to the next sustainable economic expansion and bull market.
... It is truly mind-numbing that a moment after a temporary surge of trillions of dollars, borrowed and tossed out of a helicopter (though to specific corporations and private beneficiaries), analysts would hail a subsequent improvement in corporate results as evidence of “resilience.”
What matters is sustainability, and unfortunately, it is clear that credit continues to collapse.....
Emphatically, the trillions of dollars spent over the past year were not in the interest of protecting bank depositors or the general public. They went to protect bank bondholders.
Instead of taking appropriate losses on those bonds (which financed reckless mortgage lending), those bonds are happily priced near their face value, for the benefit of private individuals, thanks to an equivalent issuance of U.S. Treasury debt. But that's not enough. Outside of a very narrow set of institutions that are subject to compensation limits, just watch how much of the public's money – which benefitted several major investment banks following a very direct route – gets allocated to Wall Street bonuses in the next few weeks.
Meridth Whithney "I Havn´t Been This Bearish In A Year"
So do i...... But at least from this point of view the market looks "rationale";-)
Genau wie ich ... Immerhin stimmt die Martbewertung wenn man diesen Maßstab ansetzt..;-)
Unlike Bernanke ( H/T Maxgreen) she at least managed to influence the $ longer than 30 minutes......No Surprise ;-) UPDATE : Bernanke vs. Meredith Whitney Mish
Im Gegensatzu zu Bernanke ( H/T Maxgreen ) hat Sie es zumindest geschafft des Verlauf des $ länger als 30 Minuten zu beeinflussen.... Keine Überraschung ;-) UPDATE :Bernanke vs. Meredith Whitney Mish
A veteran like Art Cashin is scared that the markets cannot handle ( QUOTE: "Meltdown" , "800 Point Plunge" ) a 2 percent intraday "spike" in the $......Needless to say that after Cashin finished the interview the market scored the biggest gain fueled from the "blockbuster" Government Domestic Product report since July hand in hand with a weaker $...... Shocking to see that this "bulletprove" strategy cannot work indefinitely.....
Wenn ein Veteran wie Art Cashin Angst vor einem Crash ( ZITAT: "Meltdown, "800 Point Plunge") hat nur weil der $ nach einer langen Talfahrt keine 2% intraday Erholung vertragen kann sollte man zumindest mal kurz innehalten..... Brauche wohl nicht zu erwähnen das nur Minuten nachdem Cashin die Bombe hat platzen lassen die Märkte getragen von dem "überzeugenden" Government Domestic Product den größten Tagesgewinn seit Juli haben folgen lassen.... Hand in Hand mit einem stark schwächelnden $...... Schon schade das diese "idiotensichere" Strategie nicht in alle Ewigkeit fortgeführt werden kann.....
BofA Merrill Lynch Fund Manager Survey Finds Risk Appetite at Highest Point Since April 2006
With almost all asset classes ( Dow 10.100, S&P 500 1100, N100 1780, Dax 5860, FTSE 5250, Oil $ 80 etc ) at new highs it looks like the herd mentality is once more rampant ( fueled in large part from the $ Carry Trade - €/$ 1,50 - & "Quantitive Easing" see also Speaking Of A Money Illusion........ ). Nice to see that after one of the biggest rallies in decades finally the "smart money" ( unlike the retail investor ) is getting more bullish..... As a contrarian it seems lots of folks are "all in"...... Another UPDATE: It remains to be seen if last hour drop from Wednesday was only a minor glitch in the Matrix..... Very telling that this(!!) "bulletproof" strategy seems the only relevant parameter that is important.... until it stops working ....;-) UPDATE: Taking todays ( Oct. 26th ) action into account i think this was more than a minor glitch in the MATRIX... There is now a reasonable chance that this guy will get the upper hand for some time to come..... At least all the "Cash On The Sidelines" ( sarcasm ) has now the opportunity to step in. Add to this that "Wall Street Finest" have only a sell rating on 5 percent of all stocks and the potential for some extra SCHADENFREUDE is not getting smaller.... ;-)
Da gerade heute praktisch alle Vermögenswerte nahe Ihren Jahreshochs ( Dow 10.100, S&P 500 1100, DAX 5860, MDAX 7450, TECDAX 775, FTSE 5250, Öl $ 80 ) notieren ( dank des$ Carry Trades invers zum $ - €/$ 1,50 - versteht sich, sowie dank des sog. "Quantitive Easing" , passend zum Thema Speaking Of A Money Illusion........ ) sieht es in der Tat einmal mehr so aus als wenn der Herdentrieb praktisch alle Marktteilnehmer infiziert hat... Da paßt es gut ins Bild das auch gerade jetzt die Big Boys ( ganz im Gegensatz zu dem Kleinanleger ) nach einer der größten Kursexplosion der letzten Jahrzehnte endlich Ihre Vorsicht über Bord geworfen haben und zum Teil massiv Ihr Risiprofil erhöht haben... Man könnte auch sagen das sie "all in" sind... Erneutes Update: Es bleibt abzuwarten ob der starke Abverkauf in der letzten Handelsstunde vom Dienstag nur ein kleiner Fehler in der Matrix gewesen ist... Wenn man sich aber die anscheinend momentan gängige "Strategie"(!!) ansieht wie die Märkte "funktionieren" sagt das einiges über Robustheit der Rally aus......;-) UPDATE: Nach dem heutigen ( 26. Oktober ) erneuten Abverkauf handelt es sich wohl um mehr als nur einen kleinen Fehler in der Matrix.....Es ist nun nicht unrealistischdasdieser Typ bis auf weiteres die Oberhand gewonnen hat ...... Immerhin ermöglicht dieser noch kleine Rückschlag ja den angeblichem "Cash On The Sidelines" ;- ) sich endlich massivst in den Aktienmarkt einzukaufen.....Wenn man jetzt noch bedenkt das die "Analysten" lediglich 5% der Aktien mit einer Verkaufsempfehlung versehen haben dürfte das die mögliche Schadenfreude nicht gerade mindern..... ;-)
--Investors See Brighter Corporate Profits on Horizon - Shift from Cash to Equities
Investors' risk appetite has reached its highest point in more than three years amid continued optimism about the prospects for a global economic recovery and rising corporate profits, according to the BofA Merrill Lynch Survey of Fund Managers for October
Investors are increasingly confident that the threat of a double-dip recession is waning. A net 65 percent of respondents believe a global recession is unlikely in the next 12 months, up from 47 percent a month earlier.
A net 72 percent of respondents believe the outlook for corporate profits will improve in the next year, up from 68 percent a month earlier.
The survey also shows asset allocators shifting out of cash and into equities as risk appetite grows. Their cash positions are at their lowest level since January 2004. A net 7 percent of respondents are underweight cash in October, compared to a net 10 percent overweight a month earlier.
A net 38 percent of panelists are overweight equities, up from 27 percent in September. Technology, Energy, Materials and Industrials are the favored sectors for asset allocators in October with investors still shying away from financial stocks.
Investors seeing value in Europe hits eight-year high
Asset allocators are showing a growing conviction that global corporate profits will post double digit earnings growth, the survey shows. A net 39 percent of panelists think profits will rise by at least 10 percent in the next 12 months, up from just 25 percent in September.
Optimism about Europe is pronounced in the October survey. A net 30 percent of global portfolio managers see eurozone equities as undervalued relative to other regions, the highest reading since April 2001
. A net 9 percent of panelists want to overweight the region in the next 12 months, up from 7 percent last month. This contrasts with Japan, which a net 20 percent of investors regard as the least attractive region a year ahead.
The change in sentiment coincides with a shift in investors' appetite for European financials. Investors are overweight European banks for the first time since June 2007, courtesy of greater confidence in bank balance sheets and profitability trends.
"Europe is emerging phoenix-like from the ashes as confidence in its banks boosts overall confidence in European equities," said Gary Baker, head of European equity strategy at BofA Merrill Lynch Global Research.
> Read this twice...... ;-)
> Das sollte man zur Sicherheit zweimal lesen....... ;-)
Chinese confidence rebounds: U.S. dollar confidence sinks
Confidence in the prospects for the Chinese economy and emerging markets in general remains robust. A net 49 percent of respondents think China's economy will strengthen in the next 12 months, up from 35 percent in September. A net 36 percent of respondents also said they would most like to overweight emerging markets in the next year.
Continuing weakness in the U.S. dollar has resulted in a growing number of respondents who believe the dollar is undervalued. A net 20 percent of panelists regard the currency as undervalued, compared to one percent a month earlier. Japan's economic outlook is marked by a growing number of asset allocators who view the yen as overvalued. A net 34 percent of respondents believe it is overvalued, compared to just 21 percent last month.
"Confidence in Chinese growth has rebounded but worries over a U.S. dollar crisis are on the rise. The dollar is seen as undervalued and the yen as very overvalued, suggesting that central bank intervention in currency markets in coming months could soon prove successful," said Michael Hartnett.
A total of 229 fund managers, managing a total of US$616 billion, participated in the global survey from 2 October to 8 October. A total of 195 managers, managing US$384 billion, participated in the regional surveys.
> It feels like my blog headline "Bubbles Are Normal And Non-Bubble Times Are Depressions...." is the new mantra among central banksters...... ;-)
> Ich fürchte immer mehr das meine Blogüberschrift "Bubbles Are Normal And Non-Bubble Times Are Depressions...." weltweit alle Zentralbankster erfaßt hat....... ;-)
Maybe the street has become a bit too bullish afterall.
90% of institutional investors believe that the S&P500 will rise to 1,200 by the end 2011 according to a survey by The Markets. 75% then expect it to hit 1,500 by the end of 2013, and 75% believe that the market already bottomed earlier this year. The survey covered 103 invesors in 20 countries.
We don't necessarily disagree with these views, but naturally find it disturbing to find such a strong consensus on market direction. It sets off our contrarian alarm loud and clear.
While many of our surveys of aggregate hedge fund positioning would say net long exposure has rebounded to late 2007 percentages (though on a smaller base), and mutual fund cash/asset ratios have come in significantly, markets continue to trade as if most are not satisfied with their current commitment to equities.
On economic matters, 72% of respondents believe the recession has ended, and an amusing 52% believe there is no chance of a double dip recession. It is scary that over half of the "sophisticiated community" thinks that Fed can succeed where so many central planning administration have failed before.
As assumed last Friday the Dow finally hit 10 K. After looking at the chart you probably know why i prefer gold....... I think a few years from now this ratio will be even more favourable.....Wouldn´t surprise me if we see similar ratios like in 1980 . The same is true when you price the S&P 500 in Gold .....
Wie bereits letzten Freitag hat der Dow die 10 K geknackt. Habe das mal zum Anlaß genommen das Dow/Gold upzudaten. Unschwer zu erkennen warum ich seit langer Zeit Gold bevorzuge.... Meiner Meinung nach wird sich dieses Verhältnis zukünftig noch weiter zugunsten von Gold beschleunigen.... Ich würde selbst ein Verhältnis ähnlich dem Jahr 1980 für nicht "unwahrscheinlich" halten. Ähnlich verhält es sich wenn man den S&P 500 in Gold kalkuliert .....
Team coverage today on Bloomberg by the Money Honeys as the Dow Jones Industrial Average crossed 10,000 intra-day, led by J.P. Morgan, in a move that surely epitomizes the illusions of wealth granted by modern accounting practices.
Can you believe the NYSE had the nerve to prepare new Dow 10,000 hats and distribute them for today? The first time the Dow Industrials crossed 10,000 was in 1999. The last time it closed over 10,000 was in October of 2008, just before the most recent plunge of the collapsing credit bubble.
That does not speak well of equities for the "buy and hold" crowd, which has surely had a wild ride if they have indeed managed to hold on for the last ten years, and ex-dividends and fees and commissions and inflation and a plunging US dollar and soaring commodities are... even.
AMEN :-)
UPDATE:
The following videos are too good to be buried in the comment section..... Judging from this interview Bloomberg has morphed into another version of CNBC.......
Denke die folgenden Clips sind zu gut um in den Kommentaren versteckt zu werden..... Muß gestehen das ich nach dem folgenden Interview den Eindruck habe das sich Blommberg und CNBC nicht mehr wesentlich voneinander unterscheiden......
Some very interesting charts & observations from William Hester. As i´ve written earlier i´m very sceptical ( quite an understatement ) regarding the health of the recent market rally..... I´ve added the latest from Rosenberg via Zero Hedge & another Chart via WSJ
Einige sehr aufschlußreiche Charts & Bemerkungen von William Hester. Wie bereits früher geschrieben bin ich extrem skeptisch ( leichte Untertreibung ) was die Verfassung der Märkte angeht. Ich habe zusätzlich noch was vom Rosenberg ( via Zero Hedge ) sowie dem WSJ hinzugefügt.
Is it the private client? Not really — stock funds actually had net outflows of $1.33 billion last week, while bond funds enjoyed an $8.2 billion net inflow.
Is it corporate insiders? Well, heck no — Robert Toll (CEO of Toll Brothers) just disclosed that he sold a total 1.6 million shares of his company’s stock yesterday.
UPDATE via Hulbert: They are selling a whole lot more of their companies' stock than they are buying. The net difference is even larger than it was two months ago, when I noted that insiders were already selling at a greater pace than at any time since the top of the bull market in the fall of 2007
For the week ended last Friday, according to Vickers, insiders sold 6.31 shares for every one than they bought. The comparable ratio two months ago was 4.16-to-1, and at the March lows the ratio was 0.34-to-1.
Is it buybacks? Not at all — in fact, S&P 500 companies bought back a mere $24.4 billion on stock repurchases in 2Q, down 72% from a year ago and the lowest in recorded history, according to Howard Silverblatt of Standard & Poor’s. ( great Chart via Floyd Norris )
So who’s doing the buying? Very likely it is still a combination of program trading, short coverings and portfolio managers desperately trying to make up for last year’s epic losses.
The most notable characteristic of a durable stock-market advance, which failed to appear in the recent advance, is a strong expansion of trading volume. When you adjust the trading volume data for a handful of mostly lower-quality financial stocks, the picture gets worse.
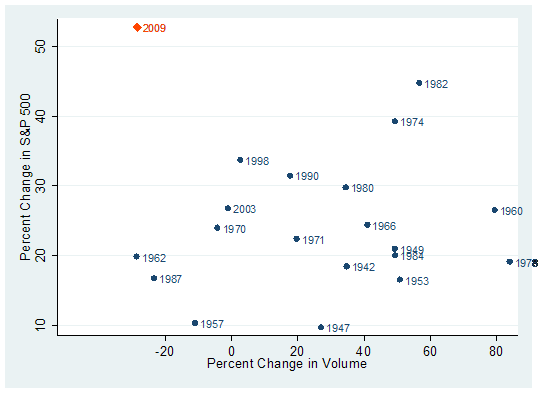
I noted in Trading Volume Separates Bull Markets from Bear Rallies that bull markets have typically begun on strong volume after selling had become exhausted. As Richard Russell has said - “volume should always be studied as a trend relative to what has preceded it”. The chart below updates one of the graphs for the elapsed time from that earlier piece. The vertical axis measures the six-month percent change in the S&P 500 from the bottom of each bear market going back to the early 1940's. The horizontal axis shows the percent change in volume over that same period.
Familiar durable bear-market bottoms stand out, like in 1982 and 1974. These rallies had strong returns that coincided with large bursts of trading volume during the first six months of the rally. There are a couple of examples, like 1998 and 2003, where bull markets had a good start on mediocre expansions in volume. But for the most part, in the cases where volume contracted the bull market beginnings have been uninspiring. More common is a strong increase in volume that coincides with gains of 20 to 25 percent during the first six months.
It's clear that this year's rally is an extreme outlier in the dataset, with above-average returns and a continued contraction in volume from the levels of trading in March.
Even so, some analysts have become optimistic because volume trends first leveled off, and then have risen marginally over the last few weeks.
But almost the entire rise in volume during the last month and half has come from a handful of stocks. Examples include Fannie Mae, Freddie Mac, Citigroup, AIG, and Bank of America
These are just five. There are a couple of other stocks that are interchangeable with these companies and would produce similar results – but the characteristic they all share is that they are financial stocks that only recently were on the brink of collapse. And since the Government's rescue of these and other financial firms, the group has risen up from the ashes. For ease of reference, we'll call these Phoenix stocks.
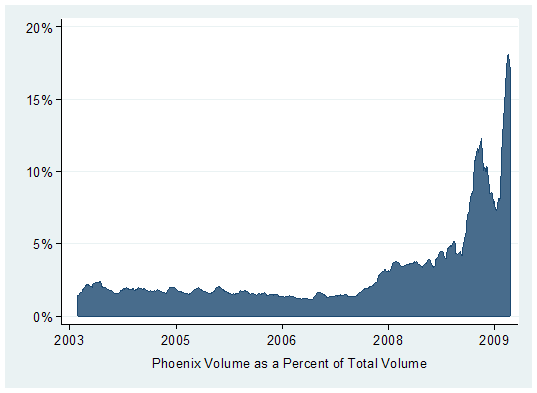
The rise in trading volumes in some of these stocks has been considerable. The shares of AIG now often trade with 15 times the volume they traded a year ago. Citigroup has traded at 12 times the amount from a year ago. This helps explain why the trades in these companies' shares are taking up a larger fraction of total share volume. The graph below shows the trading volume in the Phoenix stocks as a percent of total NYSE share volume since 2003. You can see that the trend of rising volumes in relation to total volume began during 2008, when volumes rose as the market capitalizations of these companies shares fell. Off of this year's March low, Phoenix volumes as a percent of total volume rose above 5 percent for the first time and then fell off slightly in June and July.
During the last six weeks, the trading in these stocks as a percent of total volume has jumped to almost of fifth of share trading.
Commentators and analysts have offered up a few explanations for the heavy trading in these shares – short covering, the focus of day traders, and institutional trend following programs. Each of those explanations is probably doing their part. Outside of highlighting the casino-like atmosphere that has gripped parts of the stock market, the amount of trading in these shares is less important than the role this trading is playing in the overall volume figures.
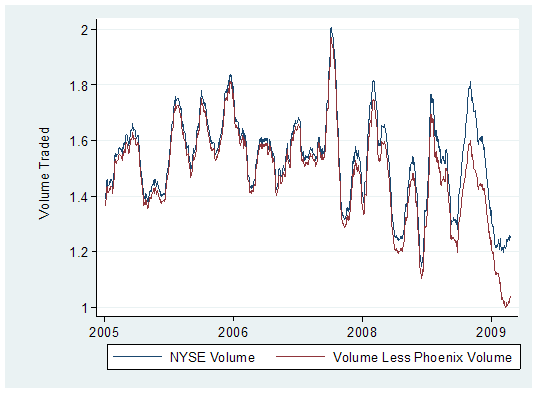
The graph below shows two measures of trading volume. The blue line is the daily share volume traded on the NYSE (smoothed). The red line is total volume less the volume traded in our group of Phoenix stocks. As the graph shows, during the last couple of years, the two lines have hardly parted. That's because the Phoenix trading volume was a small fraction of total volume. The recent divergence between the two highlights that volume outside of a handful of these financial stocks continues to contract.
On a Phoenix-volume adjusted basis, NYSE share trading is at the lowest level in years. Healthy bull markets, even if not during the earliest days of a rally, will typically recruit growing amounts of investor interest and expanding levels of volume as prices rise
Expanding volume continues to be an important characteristic missing from this rally.
If they no longer matter, I will be WRONG, and I will have to accept that the policy of ‘Print/Borrow/Spend on Rubbish we don’t Need’ is a limitless phenomena, without consequences, which means there should never be a bear market ever again….
I hope this sounds as ridiculous to you reading as it did to me when writing…..
This quote was just too good to be burried in the comment section...... ;-)
Dieses Zitat war einfach zu gut um es lediglich in den Comments zu posten.. ;-)
The S&P 500 has rebounded 49% from those March 9 lows. Imagine how abnormal a 49% rally over a five-month span is — it’s unprecedented back to the 1930s. In the last cycle, it didn’t happen until February 2004 — 18 months into that bull phase where again there was tremendous policy stimulus and an oversold low to climb out of.
In addition, household credit was expanding rapidly. Even coming into what was a secular bull market in 1982, it took a good seven months to rally 49%, and that was with the benefit of a V-shaped economic recovery.
Going back to 1950, it has taken an average of around 18 months for the market to rebound 49% from a recession trough, not five months as has been the case thus far.
Let’s examine what the macro landscape usually looks like at that magical +49% point in the equity market rally:
• Real GDP had expanded on average by 4.5% • Employment rebounded an average of 850k • The ISM manufacturing index had firmed to an average of 56.2 (the lowest print by this juncture was 53.9) • Corporate profits had recovered 12% • Bank lending rose an average of 5%
In other words, the market is way ahead of itself, because, as of the latest data points during this 49% rally:
• Real GDP is trying to make a cycle low • Employment is trying to make a cycle low • The ISM is off the low but still sub-50, at 48.9 • Corporate profits are still trying to make a cycle low • Bank lending is still trying to make a cycle low
We have never before witnessed a stock market rally of this magnitude over such a short time frame and absent anything more than tentative signs of economic improvement.
The only rally of this magnitude was the wild bear market rally ride in 1930, which was followed by a resumption of the decline that finally bottomed 82% lower in 1932.
A VERY SPECULATIVE STOCK MARKET This is the most speculative momentum-driven equity market since the early 1930s. Make no mistake, the economy is getting better but most of the diffusion indices are still below the 50 cutoff and many of the economic indicators are still in negative growth terrain
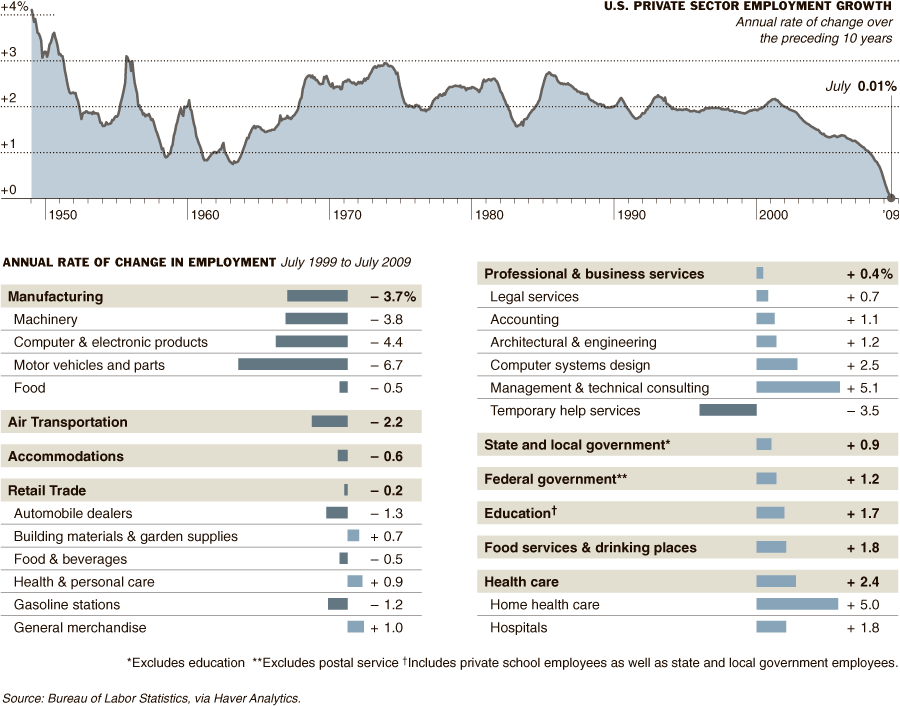
But what we have on our hands is a jobless, revenue-less, income-less, profitless and consumer-less recovery. It’s a one of a kind.
The equity market tends to bottom 3-6 months before the recession ends; normally it is four months. The S&P 500 bottomed in March, and we are now four months into this rally and while the media have declared the recession to have ended, none of the four classic ingredients that go into making that call have yet to bottom.
Hence, Mr. Market may well be way ahead of himself on this one. No doubt that the market was priced for extremely bad news at those March lows, but let’s face it, the news turned out to be pretty bad, especially for those 2.2 million people who lost their jobs since that time. That’s more than the entire March 2001-June 2003 down-cycle — in just five months.
> Just today three major German financial newspapers ( FT Germany, Handelsblatt und Welt ) had all bullish stories why stocks have room to climb higher.....At least they didn´t have their stories on the cover.... This would have triggered a perfect signal to short the market....;-) The FAZ seems to be regular readers of Zero Hedge and is therefore less "euphoric"......You really have to be brave to be long this market....... The risk/reward isn´t quite "balanced" right now......
Chart Of the Day "Today´s Rally vs Rally 1929/1930"
For a daily dose of excellent "ANTI SPIN" i highly recommend to subsribe to the free daily update from David Rosenberg.
Wer die momentan wohl beste tagtägliche Analyse frei Haus geliefert haben möchte der sollte sich hier registrieren lassen. David Rosenberg unterscheided sich nicht erst seit seinem Wechsel von Merrill Lynch zu Gluskin Sheff wohltuend von den üblichen Verdächtigen....
Rosenberg also points out that the 46% rally in 101 days is unmatched dating back to 1933. I suppose the rally could continue given the 1933 rally lasted 249 days taking the stock market up 172%. However, I would not recommend playing for it.
> Be careful if you´re still long this market...... The risk/reward ratio isn´t quite "favourable" right now..... If you´re considering to short this market i agree with Jesse ( even if it is very tempting) ..... > Denke man sollte sehr vorsichtig sein wenn man noch immer long ist...... Für meinen Geschmack ist das Chance/Risikoverhältnis wenig vorteilhaft und wie ich finde stand es sogar selten schlechter als dies momentan der Fall ist ..... Für alle die mit dem Gedanken spielen short zu gehen empfehle ich den regelmäßigen Besuch der Seite von Jesse.....
Rosenberg suggests there will be no recovery without the consumer. I suggest there will be no recovery in consumer spending, discounting of course "free money" programs like "cash for clunkers".
Of course this all depends on the definition of "recovery". At best, I think we have a "Recoveryless Recovery" before the economy slips back into a double or triple dip recession. Regardless, the stock market is priced for perfection while the odds of perfection are close to zero.
Hätte es besser nicht formulieren können.....Gilt besonders dann wennn man sich folgenden Chart ( siehe Zero 10 Year US Job Creation ) vor Augen führt....
Chart Of The Day "Depression-Era Bear Market Rallies"
You can read my take on the current rally here.....
Meine Einschätzung zur aktuellen Marktlage kann man hier nachlesen.....
via Chart Of The Day Many investors continue to look to the early 1930s for some insight into the current economic/stock market environment. While there are significant differences (global economy, credit default swaps, TARP, FDIC, etc.) between the current environment and that what occurred in the early 1930s, there are also many similarities (bank failures, bankruptcies, severe market declines, etc.). For some perspective on the current stock market rally that began on March 9th, today's chart illustrates duration (calendar days) and magnitude (percent gain) of all significant Dow rallies that occurred during the 1929-1932 bear market (solid blue dots).
For example, the bear market rally that began in November 1929 lasted 155 calendar days and resulted in a gain of 48%. As today's chart illustrates, the current Dow rally (hollow blue dot labeled you are here) is above average in both duration and magnitude relative to the average 1929-1932 bear market rally (hollow red dot).
Compared to the current rally, only one 1929-1932 bear market rally was greater in both magnitude and duration and that was the first 1929-1932 bear market rally that began in November 1929.
> Für einen weiteren erstklassigen Vergleich der aktuellen Lage mit der um 1930 herum bitte unbedingtA Tale of Two Depressions & Mega-Bear Quartet die Aufmerksamkeit schenken.


![[bear markets and stocks]](http://s.wsj.net/public/resources/images/MI-AY840A_ABREA_NS_20090920221439.gif)


![[Most Recent Quotes from www.kitco.com]](http://www.kitconet.com/charts/metals/gold/t24_au_en_usoz_2.gif)
![[Most Recent Quotes from www.kitco.com]](http://www.kitconet.com/charts/metals/gold/t24_au_en_euoz_2.gif)