Sunday, September 20, 2009

Where Is The Volume......?

Some very interesting charts & observations from William Hester. As i´ve written earlier i´m very sceptical ( quite an understatement ) regarding the health of the recent market rally..... I´ve added the latest from Rosenberg via Zero Hedge & another Chart via WSJ

Einige sehr aufschlußreiche Charts & Bemerkungen von William Hester. Wie bereits früher geschrieben bin ich extrem skeptisch ( leichte Untertreibung ) was die Verfassung der Märkte angeht. Ich habe zusätzlich noch was vom Rosenberg ( via Zero Hedge ) sowie dem WSJ hinzugefügt.

A Bear Market Lurks as Dow Nears 10000 WSJ

[bear markets and stocks]

Rosie On Who The Market Buyers Are From this morning's Breakfast With Dave:

Is it the private client? Not really — stock funds actually had net outflows of $1.33 billion last week, while bond funds enjoyed an $8.2 billion net inflow.

Is it corporate insiders? Well, heck no — Robert Toll (CEO of Toll Brothers) just disclosed that he sold a total 1.6 million shares of his company’s stock yesterday.

UPDATE via Hulbert: They are selling a whole lot more of their companies' stock than they are buying. The net difference is even larger than it was two months ago, when I noted that insiders were already selling at a greater pace than at any time since the top of the bull market in the fall of 2007

For the week ended last Friday, according to Vickers, insiders sold 6.31 shares for every one than they bought. The comparable ratio two months ago was 4.16-to-1, and at the March lows the ratio was 0.34-to-1.

Is it buybacks? Not at all — in fact, S&P 500 companies bought back a mere $24.4 billion on stock repurchases in 2Q, down 72% from a year ago and the lowest in recorded history, according to Howard Silverblatt of Standard & Poor’s. ( great Chart via Floyd Norris )

So who’s doing the buying? Very likely it is still a combination of program trading, short coverings and portfolio managers desperately trying to make up for last year’s epic losses.

Without Phoenix Stocks, Volume Continues to Contract Wiliam Hester / Hussman

The most notable characteristic of a durable stock-market advance, which failed to appear in the recent advance, is a strong expansion of trading volume. When you adjust the trading volume data for a handful of mostly lower-quality financial stocks, the picture gets worse.
I noted in Trading Volume Separates Bull Markets from Bear Rallies that bull markets have typically begun on strong volume after selling had become exhausted. As Richard Russell has said - “volume should always be studied as a trend relative to what has preceded it”. The chart below updates one of the graphs for the elapsed time from that earlier piece. The vertical axis measures the six-month percent change in the S&P 500 from the bottom of each bear market going back to the early 1940's. The horizontal axis shows the percent change in volume over that same period.
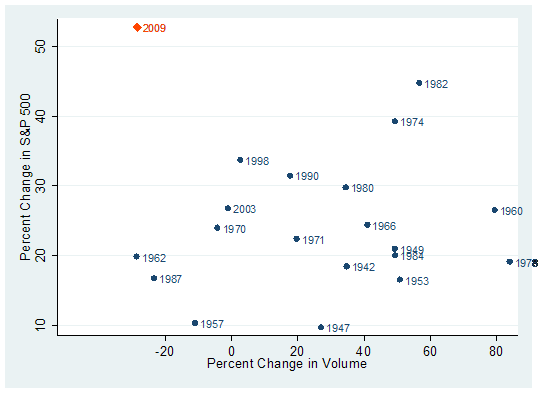

Familiar durable bear-market bottoms stand out, like in 1982 and 1974. These rallies had strong returns that coincided with large bursts of trading volume during the first six months of the rally. There are a couple of examples, like 1998 and 2003, where bull markets had a good start on mediocre expansions in volume. But for the most part, in the cases where volume contracted the bull market beginnings have been uninspiring. More common is a strong increase in volume that coincides with gains of 20 to 25 percent during the first six months.

It's clear that this year's rally is an extreme outlier in the dataset, with above-average returns and a continued contraction in volume from the levels of trading in March.
Even so, some analysts have become optimistic because volume trends first leveled off, and then have risen marginally over the last few weeks.

But almost the entire rise in volume during the last month and half has come from a handful of stocks. Examples include Fannie Mae, Freddie Mac, Citigroup, AIG, and Bank of America
These are just five. There are a couple of other stocks that are interchangeable with these companies and would produce similar results – but the characteristic they all share is that they are financial stocks that only recently were on the brink of collapse. And since the Government's rescue of these and other financial firms, the group has risen up from the ashes. For ease of reference, we'll call these Phoenix stocks.
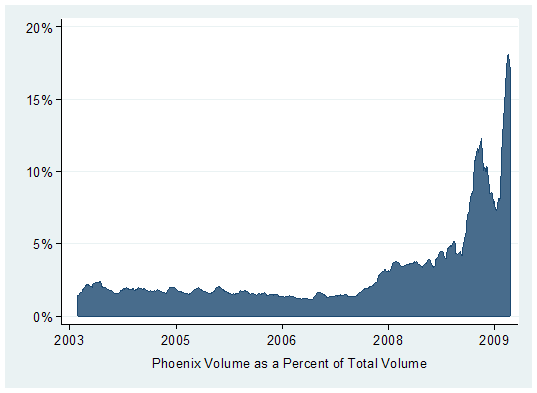


The rise in trading volumes in some of these stocks has been considerable. The shares of AIG now often trade with 15 times the volume they traded a year ago. Citigroup has traded at 12 times the amount from a year ago. This helps explain why the trades in these companies' shares are taking up a larger fraction of total share volume. The graph below shows the trading volume in the Phoenix stocks as a percent of total NYSE share volume since 2003. You can see that the trend of rising volumes in relation to total volume began during 2008, when volumes rose as the market capitalizations of these companies shares fell. Off of this year's March low, Phoenix volumes as a percent of total volume rose above 5 percent for the first time and then fell off slightly in June and July.

During the last six weeks, the trading in these stocks as a percent of total volume has jumped to almost of fifth of share trading.
Commentators and analysts have offered up a few explanations for the heavy trading in these shares – short covering, the focus of day traders, and institutional trend following programs. Each of those explanations is probably doing their part. Outside of highlighting the casino-like atmosphere that has gripped parts of the stock market, the amount of trading in these shares is less important than the role this trading is playing in the overall volume figures.

The graph below shows two measures of trading volume. The blue line is the daily share volume traded on the NYSE (smoothed). The red line is total volume less the volume traded in our group of Phoenix stocks. As the graph shows, during the last couple of years, the two lines have hardly parted. That's because the Phoenix trading volume was a small fraction of total volume. The recent divergence between the two highlights that volume outside of a handful of these financial stocks continues to contract.
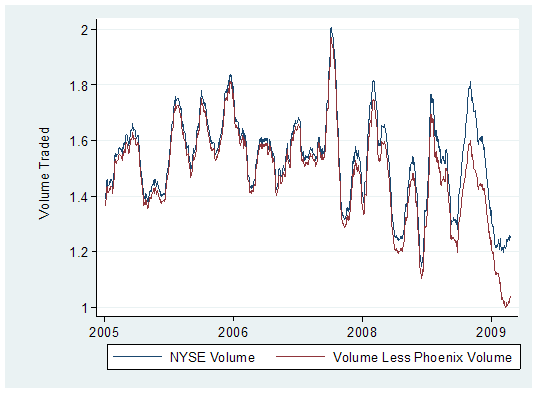


On a Phoenix-volume adjusted basis, NYSE share trading is at the lowest level in years. Healthy bull markets, even if not during the earliest days of a rally, will typically recruit growing amounts of investor interest and expanding levels of volume as prices rise
Expanding volume continues to be an important characteristic missing from this rally.

Update:

I think balance sheets and sustainability - govt, central bank AND private sector, MATTER Bob, ‘The Bear’, Janjuah via FT Alphaville

If they no longer matter, I will be WRONG, and I will have to accept that the policy of ‘Print/Borrow/Spend on Rubbish we don’t Need’ is a limitless phenomena, without consequences, which means there should never be a bear market ever again….

I hope this sounds as ridiculous to you reading as it did to me when writing…..

This quote was just too good to be burried in the comment section...... ;-)

Dieses Zitat war einfach zu gut um es lediglich in den Comments zu posten.. ;-)

Labels: , , , , , , , , ,

Thursday, June 18, 2009

Contrary Indicator.... The Retail Investor Is Back.....

Looks like the "herd mentality" ( with the help from usual vicarious agents / see Abby Joseph Cohen 2009 vs Abby Joseph Cohen 2001.....Which Call Is Worse? & The Wall Street Clown Show via Michael Panzner UPDATE: CNBC´s Dennis Kneale: "The Great Recession Is Over") has once again sucked the small investor into this very dangerous market.... Just in time after a 40 percent ( S&P from 666 to over 900, DAX from 3600 to north of 5.000, Nikkei from 7.000 to over 10K, etc..... ) runup & insiders dumping shares ( see Insiders Exit Shares at the Fastest Pace in Two Years including a very interesting chart ) .... The clip is excellent !

Es sieht einmal mehr danach als wenn der "Herdentrieb" ( auch dank der wunderbaren "Expertenunterstützung" / siehe Abby Joseph Cohen 2009 vs Abby Joseph Cohen 2001.....Which Call Is Worse? & The Wall Street Clown Show via Michael Panzner UPDATE: CNBC´s Dennis Kneale: "The Great Recession Is Over" PURE COMEDY!) einmal mehr ganze Arbeit geleistet hat und den Privatanleger im großen Stil zurück in den "verminten" Markt gelockt hat...... Nach Anstiegen von ca. 40% ( S&P von 666 auf über 900, Dax von 3600 auf fast 5200, Nikkei von 7000 auf über 10K, usw. ) und massivsten Insiderverkäufen ( siehe Insiders Exit Shares at the Fastest Pace in Two Years beinhaltet u.a. einen sehr sehenswerten Chart ) gerade noch rechtzeitig..... Klasse Clip!

Hat tip to Zero Hedge


Neesdless to say that i think Biderman is spot on & that herding is a global "phenomenon" ( see A year in perspective, Shanghai edition via FT Alphaville )......

Überflüssig zu erwähnen das ich hundertprozentig mit Biderman übereinstimme und das der Börsenwahn weltweit erneut um sich gegriffen hat ( siehe A year in perspective, Shanghai edition via FT Alphaville ) ...... UPDATE: Hier ein weiterer erstklassiger Kontraindikator.... Der ZEW Index ( Das ZEW befragt jeden Monat Analysten und institutionelle Anleger zu ihren Erwartungen an die konjunkturelle Entwicklung ) sieht charttechnisch so aus ( sicher kein Zufall das der fast identisch mit dem DAXverlauf ist..... ). Textlich geht das dann ähnlich dem Artikel im MM ( siehe ZEW-Index signalisiert Ende der Talfahrt ) über den Ticker.....

Labels: , , , , , , ,

Tuesday, September 11, 2007

Countrywide Shares Fall After Report Lender Needs More Capital

What a difference a few month made..... Mozillo deserves every Schadenfreude that is out there.....Make sure you don´t miss this Video "Cramer praising Countrywide and Mozillo" just a few month ago. The quotes from Cramer and Mozilla are just priceless! A classic!

Welch ein Unterschied doch ein paar Monate ausmachen......Der CEO Mozillo verdient alle nur erdenklichen Schadenfreude ..... Ich kann jedem dieses erst ein paar Monate alte Interview mit dem Interview mit dem CEO empfehlen. Es ist nicht zu fassen das diese Zitate und Aussagen erst 6 Monate alt sind.... LOL!

Thanks to Stock Mania

Countrywide Shares Fall After Report Lender Needs More Capital
Sept. 11 (Bloomberg) -- Countrywide Financial Corp., the biggest U.S. mortgage lender, fell almost 5 percent in early trading after the New York Post reported that a second multibillion-dollar bailout ( should be investment) of the company is being negotiated.

``Countrywide is in desperate need of cash right now to continue funding mortgages, and the credit markets are still largely closed to them,'' the newspaper said, quoting a source familiar with the company.

> Maybe they shouldn´t have waste their borrowed money buying back stocks just a few month ago.....

> Es wäre wohl besser gewesen während der letzten Monate nicht mit geborgtem Geld eigenen Aktien zurückzukaufen......

Countrywide .... Genius At Work......
Countrywide conference call review october 2006

"Additionally, as previously announced, management is executing a capital optimization plan and the Board of Directors has authorized a share repurchase program of up to $2.5 billion. In connection with this program, the Company intends to repurchase $1 billion to $2 billion of its common stock in the fourth quarter financed through the issuance of high equity-content debt securities."
from May 2007!
Countrywide Financial Corporation Announces Agreement to Sell $2 Billion of Series A Floating Rate Convertible Senior Debentures Due 2037 and $2 Billion of Series B Floating Rate Convertible Senior Debentures Due 2037

Countrywide Financial will use a portion of the net proceeds from this offering to fund repurchases of up to 23 million shares of its common stock simultaneously with this offering and expects to use the remainder for general corporate purposes.
> Needless to say that during that time Mozillo has sold lots of shares.....

> Überflüssig zu erwähnen das der CEO während dieser Zeit Tonnen von Aktien abgeladen hat.....


Thanks to The Mess That Greenspan Made

Goldman Sachs Group Inc. and the law firm Wachtell Lipton Rosen & Katz are working with Calabasas, California-based Countrywide to negotiate a cash infusion similar to the $2 billion package Bank of America Corp. agreed to provide last month, the newspaper said. Possible lenders include JPMorgan Chase & Co. and Citigroup Inc., according to the Post.

Countrywide said last week it would eliminate as many as 12,000 jobs, or 20 percent of its workforce, after investors stopped buying loans and lenders alarmed by rising subprime defaults refused to provide capital to mortgage companies.

Countrywide was at $16.36 in early trading, down 4.9 percent from the close yesterday on the New York Stock Exchange. The shares have lost almost 60 percent of their value this year.

Countrywide was forced to tap $11.5 billion of emergency financing last month to replace hard-to-sell commercial paper.

Disclosure: Short KBW Mortgage Finance Index (including CFC)
AddThis Feed Button

Labels: , , , ,

Thursday, March 08, 2007

insider sales / trim tabs

mhhhh. i try to tell the other side of the story. when you read the headline from trim tabs it sounds great a like a vote of confidence that insiders didn´t panic. and it is very "uncool" to give only one side of the story and forget the far more important story of the insiders who has seen this "pullback" as a great buying opportunity......so you can choose your direction if this is bullish or bearish news.....

mhhhh. ich probiere hier mal die andere seite der medaille zu zeigen. nach betrachten der überschrift kann man den eindruch bekommen das dieses eine art von vertrauensbeweis für den aktienmarkt ist. leider ist dieses bild unvollständig. die viel wichtige komponente der insiderkäufe ist hier nicht gennant worden. es wäre in der tat ein gutes zeichen gewesen wenn der letzte "pullback" zu käufen genutzt worden ist....sucht euch selber aus wie ihr das interpretieren wollt.


Insiders didn't panic in recent stock market slump
Insiders sold net $2.26 bln last week, much less than previous weeks
When many investors were rushing to sell during last week's slump, people with the possibly the best insight into the health of the stock market weren't panicking,
Insiders sold a net $2.26 billion worth of shares last week, when the Dow Jones Industrial Average lost 4.3%. That was lower than each of the previous four weeks, according to TrimTabs. ( wich were close to new records / diese auf neuen rekordhöhen waren)
"he is fine as long i take my medication"! same could
be said when you read the statement from trim tabs!

Insider selling was much higher earlier in February, before the market slumped. During the week beginning Feb. 12, insiders sold a net $4.85 billion. The week before that, they unloaded a net $4.74 billion. On Feb. 7 alone, insiders sold a net $2.48 billion of stock - more than the whole of last week combined, TrimTabs data show.
wait a secound! add this together and insiders have unloadet over $ 12 billion in just 3 weeks and this should give investors confidence..... here is a chart of last years peak. too dumb that they didn´t mention how many insiders were buying! this is a vote of confidence and not a slighty reduced pace in unloading!
nicht so schnell! addiert nur die gennanten 3 wochen zusammen und man kommt auf eien betrag der 12 mrd$ übersteigt. wahrleich ein vertrauensbeweis. ....hier seht ihr einen chart der den jahresverlauf in 2006 zeigt. schade das trim tabs nicht die anzhal der läufe genannt hat. das wäre ein wahrer vertrauensbeweis und nicht die tatsache das das extreme tempo der verkäufe sich verlangsamt hat.


"Insiders don't believe the market is going to crash. They were pretty optimistic during the recent declines," ..... "The fact that they haven't been selling much in the past week is a bullish sign for the stock market."
thanks to keith and his http://housingpanic.blogspot.com/ and


Indeed, in the days immediately after the Dow fell more than 3% on Feb. 27, insider selling fell to its lowest level since late January (excluding the President's Day vacation), TrimTabs data show. ( here we go again, relativeley speaking....mein lieblingwort " relativ gesehen.....)

Insider selling was much higher at the end of last year, when the U.S. stock market was steadily climbing to records.

In November and December, net insider selling topped $25 billion. During one day in early December, insiders sold a net $21.25 billion, TrimTabs data show
the ratio back than / so übel sa es im november aus
Insiders sold $8.4 billion in shares last month, ....... Buying was almost $133 million, for a sell-buy ratio of 63.18. http://immobilienblasen.blogspot.com/2006/12/insider-stock-sales-highest-since-1987.html

Labels: ,