The "Money Flow" Myth and the "Liquidity" Trap / HUSSMAN
this only a very small sample of the good and long post with quotes like this.
dieses ist nur ne kleine zusammenfassung. in dem report von hussman verstecken sich zitate wie
I've noted for some time that S&P 500 earnings are at the very top of their long-term 6% peak-to-peak growth trendline – a level of earnings that has typically been associated with an average price/earnings multiple of 10 (not the current 17). See last week's market comment for a review of these conditions. Meanwhile, the dividend yield on the S&P 500 is about 1.9%.

In order for the S&P 500 to achieve a “normal” annual return of about 11% over the coming 5 years, we have to assume a maintenance of record margins, sustained top-of-channel earnings growth (which has never before been sustained for such a period), and an expansion of valuations to a multiple of 20 times peak earnings (the same multiple as at the 1929 and 1987 peaks, which is double the average historical multiple on top-of-channel earnings). Investors should think now about whether these assumptions are plausible, because they may find themselves wondering later why they ever did.
My impression is that the probable expectation for total returns on the S&P 500 over the coming 5-years is below 5% annually, in a likely interval that includes zero. It takes implausibly optimistic assumptions to move substantially above that range.
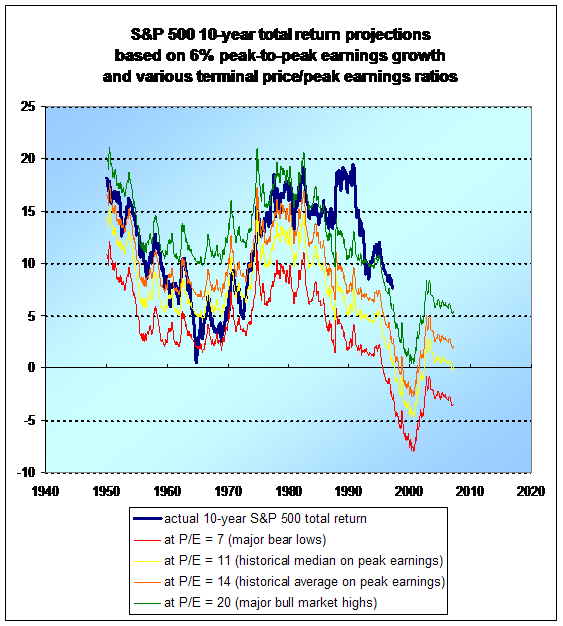
As for 10-year returns, for which the historical evidence has typically allowed tighter confidence intervals, the following chart updates the study that appeared in the February 22, 2005 market comment (“The Likely Range of Market Returns in the Coming Decade”) using the same methodology. Note that actual market returns moved outside of the typical range only during the late 1990's bubble, and that the most recent 10-year return of about 7.6% since 1997 has been at the top of the expected range precisely because current valuations are at the top of historical norms.
Currently, the likely range for S&P 500 returns over the coming decade is between a -3% annual loss and a 5% annual return, centering in the low single digits. That range will seem preposterous to some investors, but remember that it took the late 1990's market bubble to move actual returns even 5% outside of this set of bands. Unless investors anticipate a repeated excursion into similar valuation extremes, it would be a good idea for them to recognize now, rather than later, that stocks are unlikely to produce satisfactory long-term returns from current valuations.
dieses ist nur ne kleine zusammenfassung. in dem report von hussman verstecken sich zitate wie
" am increasingly losing confidence that Wall Street
operates on a well-defined base of knowledge. Instead, I am struck by the number of platitudes and false constructs that seem to dominate the investment management industry."
click on the headline to read the full piece / bitte auf die überschrift klicken
I've noted for some time that S&P 500 earnings are at the very top of their long-term 6% peak-to-peak growth trendline – a level of earnings that has typically been associated with an average price/earnings multiple of 10 (not the current 17). See last week's market comment for a review of these conditions. Meanwhile, the dividend yield on the S&P 500 is about 1.9%.

In order for the S&P 500 to achieve a “normal” annual return of about 11% over the coming 5 years, we have to assume a maintenance of record margins, sustained top-of-channel earnings growth (which has never before been sustained for such a period), and an expansion of valuations to a multiple of 20 times peak earnings (the same multiple as at the 1929 and 1987 peaks, which is double the average historical multiple on top-of-channel earnings). Investors should think now about whether these assumptions are plausible, because they may find themselves wondering later why they ever did.
My impression is that the probable expectation for total returns on the S&P 500 over the coming 5-years is below 5% annually, in a likely interval that includes zero. It takes implausibly optimistic assumptions to move substantially above that range.
As for 10-year returns, for which the historical evidence has typically allowed tighter confidence intervals, the following chart updates the study that appeared in the February 22, 2005 market comment (“The Likely Range of Market Returns in the Coming Decade”) using the same methodology. Note that actual market returns moved outside of the typical range only during the late 1990's bubble, and that the most recent 10-year return of about 7.6% since 1997 has been at the top of the expected range precisely because current valuations are at the top of historical norms.

Currently, the likely range for S&P 500 returns over the coming decade is between a -3% annual loss and a 5% annual return, centering in the low single digits. That range will seem preposterous to some investors, but remember that it took the late 1990's market bubble to move actual returns even 5% outside of this set of bands. Unless investors anticipate a repeated excursion into similar valuation extremes, it would be a good idea for them to recognize now, rather than later, that stocks are unlikely to produce satisfactory long-term returns from current valuations.
Labels: hussman, peak earnings, profit margins, sp500 vs peak growth trend
![[Most Recent Quotes from www.kitco.com]](http://www.kitconet.com/charts/metals/gold/t24_au_en_usoz_2.gif)
![[Most Recent Quotes from www.kitco.com]](http://www.kitconet.com/charts/metals/gold/t24_au_en_euoz_2.gif)

0 Comments:
Post a Comment
<< Home