cheap markets........
click on the headline to read the full piece
wirklich billige bewertungen....klickt auf die überschrift um den vollen kommentar zu lesen

The latest Investors Intelligence figures are at 53.3% bulls and just 20% bears. At such points, the average return/risk profile of the market has been unfavorable, regardless of apparent market strength.....
Normalized earnings
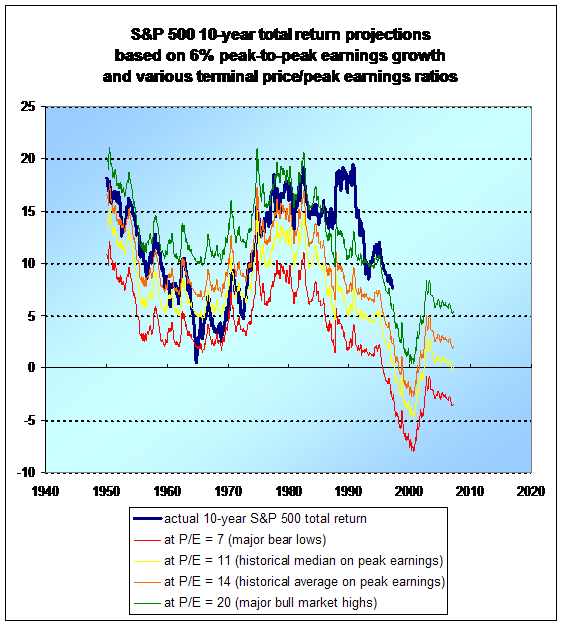
....As I've frequently noted, market P/E ratios should be (and generally have been) dirt cheap when earnings are unusually elevated. You can run a long-term 6% growth trendline over the cyclical peaks in S&P 500 earnings about as far back as you care to go. Historically when earnings have been anywhere within 10-15% of that trendline, the average P/E on the S&P 500 has been just about 10. At a multiple of over 18 times top-of-channel earnings, present valuations clearly look rich.

So it was not surprising to read Steve's conclusion that, on a normalized basis, the valuations for the largest 3000 U.S. stocks are currently in the 97% percentile of historical experience, noting “A correction back to the historical valuation median implies a 35% decline.”
What did surprise me a bit was his conclusion that as of April 30th , the normalized P/E for the large-cap stocks in the S&P 500 (using a 5-year averaging method) was only in the 81st percentile, implying a 21% decline to the historical median, and that restricting the history to the period from 1957 to-date, the current value was only in the 72nd percentile, implying just an 8% decline to the (higher) median for this period.
If you think about it for a minute though, that result makes perfect sense. Unreliable estimates of overvaluation – but perfect sense. See, people who work with statistics a lot recognize that averages can be skewed by a few extreme values or “outliers.” So a careful analyst will often use medians (the middle point when you sort the data in order from lowest to highest values) to get a better idea of the “central tendency.”

So far, so good. The problem is that if you reduce the number of data points, or include a whole set of extreme and unrepresentative values, even the median will give you skewed results. If you do both – your median will become unreliable.
The case in point here is the late-1990's bubble period. Here we have about 18 quarters of really extreme data in terms of normalized valuations, seen nowhere before in history and already known to have produced very unsatisfactory returns. Even including the recent advance, the total return on the S&P 500 remains below Treasury bill returns for the past 8 years.
Even if we aren't calculating an average, the addition of these points in a median calculation still ends up skewing the median higher because those points are all distributed on one side, and raise the level at which the midpoint is found. Using data since 1926, excluding the bubble, the median normalized P/E is closer to 30% below present levels. ....
Suffice it to say that unless one expects to see late-90's level valuations with regularity in the future, they shouldn't be included in an estimate of central tendency for valuations. ....
A final remark has to do with using a 5-year average of earnings to normalize P/E ratios. When we look historically, we see a clear tendency for earnings growth to be higher from points when earnings were well below their long-term 6% trendline than when they were close to that level. Since trends in earnings have tended to ebb and flow over periods of more than 5 years, using a 5-year average when the general level of earnings is depressed relative to trend will still give you a relatively high P/E. Conversely, using a 5-year average when the general level of earnings is near the peak trendline will produce a lower P/E. If investors don't correct for this, they can still confuse elevated earnings for cheap valuations.
At present, we've got earnings pushing the extreme of that historical trend, and yet the normalized multiple isn't even low. That's doubly problematic
An optimistic route to a poor market outlook
You can imagine that a P/E based on 5-year average trailing earnings will be using “unrepresentative” earnings figures anytime the economy is in recession. Using those depressed earnings will still tend to depress the 5-year average and therefore lift the resulting P/E.
As an alternative, we can take the most optimistic route, which is to base the 5-year average on the highest level of earnings attained up to each year. So for example, the current 5-year average would include the peak earnings as of 2003, the peak as of 2004, as of 2005, as of 2006 and as of 2007. If earnings in any of those years were below their peak to date, you'd use the peak value instead. If you do that, you get the following historical valuation chart, using data since 1871. You can see why one might not want to include the late 90's bubble in one's calculation of “normal valuations.”

You can also see that today's values are at the same level as they were about 8 years ago. Did I mention that the S&P 500 has underperformed Treasury bill yields since then? Ah, yes. I believe I did
Labels: hussman, p/e, pe ratio, peak earnings, sp500 vs peak growth trend
 Presently, the market's valuation on the basis of price/revenue, price/book, and price/dividend is higher than at any prior historical market peak on record except the 2000 peak.
 As I've detailed in recent weeks, that approach has ridiculous implications even in the data sample (1980-2000) that was used to construct it, and is quickly and easily verified as pure garbage in pre-1980 data, using any proxy remotely close to estimated “forward earnings




![[Most Recent Quotes from www.kitco.com]](http://www.kitconet.com/charts/metals/gold/t24_au_en_usoz_2.gif)
![[Most Recent Quotes from www.kitco.com]](http://www.kitconet.com/charts/metals/gold/t24_au_en_euoz_2.gif)


