Tuesday, October 31, 2006

Buyout Firms Punish Bondholders by Gorging on Record Dividends

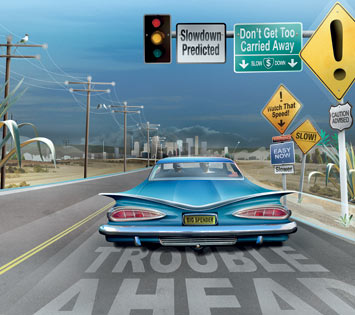
würde mal darauf setzen das es in 2007 und 2008 den ersten streßtest in sachen geplatzter lbo geben wird.

i would bet that the stress test for lbo deals will come 2007/2008 whne the credit market maybe is drying up.

make sure you also read this piece about the excess in private equity from business week/unbedingt lesen!
http://immobilienblasen.blogspot.com/2006/10/private-equity-excess-business-week.html
http://immobilienblasen.blogspot.com/2006/10/dangerexplosive-loans-another-credit.html

http://tinyurl.com/yzf9mf
Nov. 1 (Bloomberg) -- After Weetabix Ltd., the maker of Britain's best-selling breakfast cereal, fired 7 percent of its workers and canceled the employee bus service to free up cash for debt from a leveraged buyout, the Kettering, England-based company borrowed 130 million pounds ($249 million) so it could enrich owner Lion Capital.

Bondholders worldwide are suffering a double whammy this year because more than 80 companies controlled by LBO firms have borrowed at the expense of workers and debt investors just so they can pay themselves dividends, ( but nobody forcec them to buy these bonds! bad luck of course when the bonds are already qwned when the compony is taken over/ niemand zwingt die investoren die anleiehn zu kaufen. blöd natürluch wenn die bonds bereits vor der übernahme im bestand waren)

``We don't like it,'' said Andrew Wilmont, who helps manage $65 billion of fixed-income assets at Axa Investment Managers in London. ``The more you leverage up the company, the less the company has to fall back on if things turn bad.''

Firms such as New York-based Blackstone Group LP and Kohlberg Kravis Roberts & Co. completed $269 billion of LBOs this year by borrowing at least $166 billion in loans and bonds, ...

Companies owned by the LBO groups sold an additional $30 billion of debt this year for dividends, said S&P. The payments have helped the firms recoup 86 percent of their investments within two years, according to Fitch Ratings.

LBO firms, which typically borrow two-thirds of the money they pay for acquisitions, used to wait three to five years before profiting from selling shares in their companies.

Hertz Bonds
The debt of companies owned by buyout firms has risen to the equivalent to 5.4 times their cash flow, the most ever, S&P says. ...

Payouts to buyout firms were partly to blame for the lagging performance of bonds sold by Hertz Corp., Brake Bros Plc and Impress Holdings BV. Their bonds trailed the 8 percent average return this year for securities with junk ratings, costing holders about $70 million in total,

Hertz pummeled bondholders after the rental-car company said in September 2005 it was being acquired for $15 billion. Its $175 million of 7.625 percent notes due 2012 lost as much as 10 percent of their face value. S&P cut the ratings on the Park Ridge, New Jersey-based company to BB- from BBB-.

`Bad for Credit'
Just six months after the buyout, Hertz used a $1 billion loan to pay a dividend to its new owners,

Hertz's $1.8 billion of 8.875 percent bonds due in 2014 yield 334 basis points more than similar-maturity Treasuries, 5 basis points more than before the dividend.

The price of the bonds has risen 1.9 percent in the past two months. That's less than half the 5.3 percent average increase for debt with BB ratings in the same period, according to Merrill. Investors holding Hertz's $3.3 billion of bonds would have made $60 million more by investing in a Merrill index of similarly rated bonds. ( why not sell this crap!/warum vertickert ihr das nicht)

The company plans to reduce debt and pay its owners another dividend, this time $427 million, when it raises as much as $1.83 billion in an initial public offering, (poor buyers of this ipo!/würde ich nicht zeichnen))

``Any time you replace equity with debt, that's bad for the credit,'' said Steven Bavaria, head of loan and recovery ratings at S&P in New York. ``You're bound to see an increase in the risk of default.''

Rise in Defaults
A slower economy may boost yield premiums on companies owned by leveraged buyout firms by more than 2 percentage points, ....

Bondholders typically lose 64 percent of their investment when a company defaults, according to Moody's. More borrowers will struggle with repayments next year, pushing the default rate on junk bonds to 2.8 percent by the end of 2007 from a nine-year low of 1.5 percent now, Moody's said.

``The simple fact is that the more leveraged you are, the more you're going to suffer when the cycle turns,''

Investors haven't turned down the new bonds because they yield as much as 2 percentage points more than debt from companies with similar ratings. (too much liquidity/anlagenotstand)

Higher Yields
Weetabix will pay annual interest of 13 percent for the next decade because of the dividend to Lion Capital. That's almost double the cost on loans it used earlier this year to refinance debt from its 2004 buyout,

``There were people who'd been there for 30 or 40 years,'' Dave Thom, regional organizer of the union that represents production workers at Weetabix, said of the 119 people who lost their jobs. ``They're destroying a community.'' (endgame could be is destroying the company/unternehmen)

When Paris-based cable television company Numericable SA borrowed 500 million euros ($635 million) to pay dividends to London-based buyout firm Cinven Ltd. in July, investors required interest of 9.125 percentage points more than the euro interbank offered rate, a lending benchmark. That was about 2 percentage points above the average for comparable notes,

`Vulnerable to Nonpayment'
Brake Bros, the Ashford, England-based food distributor, sold 275 million pounds of bonds in September to pay a dividend to Clayton Dubilier. The securities yield about 12.95 percent, or 7.75 percentage points more than the London interbank offered rate.

The sale drove up the yield on Brake Bros' existing 105 million euros of 11.5 percent notes due in 2011 to 9.4 percent from 9.2 percent. The securities yield about 2.2 percentage points more than similarly rated bonds, according to Merrill Lynch indexes.

S&P cut Brake Bros' ranking to CCC+. Bonds with that rating are ``vulnerable to nonpayment,

Exit Strategies
``Hedge funds and credit funds like the return and can make a judgment with respect to the company's equity value,'' said Eric Capp, head of European high-yield capital markets at JPMorgan Chase & Co. in London, which arranged the bond sales that paid the dividends by Brake Bros and Impress. ``As long as they're feeling confident the debt will eventually be refinanced with an exit, they're willing to buy it.''

Some firms are choosing dividends instead of selling stock, the traditional exit strategy in an LBO. London-based Doughty Hanson & Co. paid itself almost half the proceeds from a 1 billion-euro bond sale in September by Impress, which makes cans for StarKist tuna and 9-Lives cat food.

The Deventer, Netherlands-based company didn't sell shares because it sees ``considerable further upside,'' said Chief Financial Officer John Geake in an interview. Acquisitions will boost revenue, he said.

Impress's 250 million euros of 9.25 percent notes due 2014 lost 1.5 percent of their face value since the sale. Investors would have gained 1.3 percent in an index of similarly rated debt,

Adding Leverage
The combination of borrowing for dividends and delaying stock sales has triggered five times more downgrades than upgrades, according to Lehman Brothers.

``They're choosing to pay out a dividend, add more leverage and forestall what's typically a good event for bondholders in an IPO,'' said Paul Scanlon, managing director for U.S. high-yield and bank loan assets at Putnam Investments in Boston, which owns Hertz bonds in its $62 billion of funds. ``Any excess cash for paying down debt or reinvesting in the business isn't going to happen.''

Some investors say the LBO firms are getting too greedy.

``There's too much going back to the buyout firms,''


3 signs that a stock crash is coming

ich denke zumindest das ne korrektur kommen wird.
i think that at least a correction is coming.

Three major indicators with strong track records are signaling it's time to sell stocks. Here's how they work and why investors should worry. http://tinyurl.com/yet7xt

What a great time to own stocks.

The Dow Jones Industrial Average is setting records just about every day. The S&P 500 Index has advanced 12% in less than five months. Technology stocks are up about 14% since midsummer.

The giddy stock bulls may be in for a nasty surprise. They're ignoring three trusty stock-market indicators -- with great records for predicting corrections -- that currently are saying it's time to get out of equities. ....

One of the indicators says stocks are simply expensive compared with other investment options available to big money managers. Another says that mutual fund managers have mostly exhausted the supply of dollars they have available to put into the market. And the third says that the smartest investors are now betting on a downturn. Together, these harbingers paint a far different picture of the market than do the raw return numbers. ( i would add the inverted yield curve!/nicht zu vergessen die inverse zinskurve, high insider sales + valuations )http://immobilienblasen.blogspot.com/2006/10/hussman-on-sp-500-valuation.html

Here's a closer look at these indicators and why you should be cautious with stocks now.

The stock-bond trade-off
Money managers chiefly put money in two assets: stocks and bonds. One way of deciding whether stocks are expensive is by comparing their performance to that of bonds. If bonds lag while stocks advance, according to some market watchers, fund managers will be more likely to sell stocks and buy bonds.

..... Now, though, with the recent rally in stocks, there's a big gap. ....The difference between the current gap and the 90-day average is at a level seen only 1% of the time. (For you statistical wonks, the indexes are now more than three standard deviations away from the norm). "Stocks are rarely as overvalued to bonds as they are now," says Goepfert.

In the three months after such an extreme reading, the performance of the S&P 500 has ranged from a loss of 8.7% to a gain of just 1.7%. That's a bad outlook for the bulls. It gets worse: This indicator has called two of the biggest market declines in the past decade.

It flashed red just before the big correction that started in March 2000, signaling the end of the technology bubble. By the end of 2002, the S&P 500 had fallen more than 45%. (On the upside, this model said buy in mid-2002, just before the start of the current bull rally.)

On July 17, 1998, the model said sell just before a dramatic crash that took the S&P 500 down 19% in the next month and a half. On Aug. 31 that year, the model said buy just before a September rally that took the market up 11% in a month. (never heard of this incicator. i wouldn´t buy either bonds or stocks in the us (ex goldmines), nie von deisem indikator gehört. ich würde wereder aktien noch anleiehn in den usa kaufen (ex. goldminen)

Cash-strapped mutual funds
Mutual funds are allowed to hold cash instead of stocks or bonds. How much cash they have on hand is often a good signal of where the market is heading. If they have a lot of cash, it means there's still a lot of money left to go into stocks. When cash levels are low, it means there's less money on the sidelines to drive stocks higher. .....

As of the end of August, U.S. equity mutual funds had 4.4% of their assets in cash, according to the Investment Company Institute. Goepfert adjusts this number for how much cash they should have on hand given the current level of interest rates. Even though interest rates are relatively low, Goepfert figures that funds should have a 7% cash position, according to historical trends. This means funds have 2.5% less cash than they "should" have, given the level of short-term interest rates. This is another historic extreme.

Since 1950, whenever cash shortfalls hit these lows, the S&P 500 has fallen 69% of the time with an average decline of 4%. Ominously, the last two times cash levels were this low, bad things happened to stocks. Cash levels hit these lows in early 2000 just ahead of the last big bear market. Cash also hit current levels in early 1981 just before a two-year market slump. ( i think the main difference in the short run is that the main market action is driven by hedge funds, der hauptunterschied im marktgeschehen ist wohl der einfluß der hedgeonds)

The smart money is bearish
Investors, of course, always want to know what the "smart money" is doing.

..... The CFTC designates the biggest traders -- those holding more than 1,000 S&P 500 futures contracts -- as "commercial" traders. They only make the grade if they hold those futures contracts as a part of a hedge to protect against losses in underlying investment positions.

Goepfert considers these commercial traders to be the "smart money." (The other two categories are big speculators, who hold 1,000 or more S&P 500 futures contracts that aren't part of a hedged position, and small speculators, who hold less than 1,000 contracts.)

Right now, commercial traders have a $30 billion net short position in futures on the S&P 500, the Dow Jones Industrial Average and the Nasdaq Composite Index . Going short is a bet against the market.

This is only the third time in recent history that this short position has been so large. The other two times were early 2001, just before the S&P 500 tumbled 38%, and November 2004, after which the market rose some more and then corrected in early 2005.

A ray of sunshine
Taken together, these three indicators say its time to be more cautious with stocks -- but they don't mean that a sharp correction is 100% certain.

Here's just one dissenting voice: Robert Froehlich, chairman of the investor strategy committee at DWS Scudder, the U.S. mutual fund division of Deutsche Bank. Froehlich points out we are moving into the seasonally bullish phase for stocks. This is the six months from early November to the end of April, a period Froehlich calls "turkey to tax time." Since 1950, the average return of the S&P 500 during this phase has been 9%. The average return of the S&P 500 during the other six months of the year was only 2.71%.http://immobilienblasen.blogspot.com/2006/10/halloween-indicator-chart.html


flippers in real trouble......

ihr solltet die komplette gallerie der gescheiterten spekulationen sehen.
make sure you see the whole gallery of flips that went flops!!!
http://flippersintrouble.blogspot.com/


Total Loss: $158,500Percent Loss: 30.6%
Asking Price: $360,000
Bedrooms:3 Baths: 1 Sq. feet:1262

Previous Sales:
Sold on 2005-12-02 for $518,500

MLS# 60112107 Google Maps
Assessed Value Property Tax Bill


dank geht an max! von http://flippersintrouble.blogspot.com/

why is this not ongoing business for a reit?

first there was the nat asset value (nav), then the divyield as a valuemeassure. now the ffo (ex impairments), whats next to pump up the stock.....by the way the pe is 66 (yahoo finance)

zuerst war als bewertungsgrundlage der innere wert, dann die dividenrendite. jetzt der flow from operations (ex abschreibungen). was kommt als nächstes um den wert zu pumpen ..
das kgv beträgt übrigens 66 (lt. yhoo finance)

Insider Purchases - Last 6 Months
SharesTrans
PurchasesN/A0
Sales709,66411
Net Shares Purchased
(Sold)
(709,664)11
Total Insider Shares Held1.86MN/A
% Net Shares Purchased
(Sold)
(27.6%)N/A


more on the reits bubble from mike larson
http://www.moneyandmarkets.com/press.asp?rls_id=433&cat_id=6

Equity Office’s results fall on impairment charges


Equity Office Properties Trust Tuesday said third-quarter funds from operations, a key measure of REIT financial performance, swung to a net loss of a penny a share from 50 cents a share in the year-ago quarter.

The office-property owner and operator said quarterly FFO included non-cash impairment and severance charges totaling 54 cents a share. Analysts surveyed by Thomson First Call had forecast, on average, FFO of 51 cents a share. Equity Office said its third-quarter net loss of $139.4 million, or 40 cents a share, was caused by a previously announced impairment charge of $188.9 million taken in anticipation of future asset sales.We continue to reposition our portfolio to take advantage of the positive momentum in office markets,” said Chief Executive Richard Kincaid in a statement

divyield is close to 3%. riskfree treasuries are 50% higher! that makes sense.......

ha. positive momentum means impairments? / positives momentum bedeutet also abschreibung?

upade conference call:

3.5 b$ assets are on the block for sale and the gain on sale is expectet to be far greater than the bocked impairment (if the markets stay strong..../ 700 mio$ bookgain expectet)

quote ceo " it´s a little crazy out there" deals are in the making that makes no sense.

inflation everywhere: utilities, taxes, construction costs, maintenance cost, labourcosts etc.

if prices hold up maybe more assets up for sale

deleveraging and strong balance sheet are main goal (reason should be clear....)

money supply is running wild!

dies erklärt sehr schön die absurden bewertungen und die nicht vorhandenen risikoaufschläge.

this explains why the markets acts without fear.

Global Cash Glut Fuels Investment Boom, Rate Concern
http://tinyurl.com/ygtulf


Oct. 30 (Bloomberg) -- Markets around the world are awash in excess cash, fueling a frenzy of investment from London to Tokyo that may lead central banks to push interest rates higher than investors now anticipate.

Money remains cheaper than in the 1990s even after every major central bank raised rates this year, the first simultaneous tightening since 2000. The cash glut is reheating the U.K. housing market, while in Japan companies plan the most investment since 1990. China's biggest bank this month attracted orders for more than half a trillion dollars with its initial public offering of shares.

``Interest rates in the main economies have still not been raised enough,'' ..... ``There is a buoyancy in asset prices one gets with high-risk monetary growth.''

Without further tightening, central bankers may have new asset bubbles and inflation risks on their hands.

The European Central Bank, whose officials voice the most concern, is convening a conference in Frankfurt next week on the role of money growth in guiding interest rate policy. Among participants: Federal Reserve Chairman Ben S. Bernanke, People's Bank of China Governor Zhou Xiaochuan and Bank of Japan Deputy Governor Kazumasa Iwata. (what a waiste of time / was für eine zeitverschwendung....)

Pressure on ECB
``When monetary growth is strong, the housing markets are very dynamic and the stock markets are vigorous
, the probability of an inflationary episode within three or four years is very strong,'' says Jose Manuel Gonzalez-Paramo, a member of the ECB's executive board. (mhhh, inflation is spiking the last view years. and that despite the cheap imports from china etc, the assetpriceinfaltion is running amok since 2005/ die inflation ist doch jetzt schon am steigen und das trotz der billigen importe etc. ,die vermögenswertinflation läuft seit 2005 schon amok)

The ECB, unlike other major central banks, explicitly uses money supply to gauge inflation. Growth of M3, the bank's preferred measure for the 12 nations sharing the euro, unexpectedly accelerated to 8.5 percent in September, close to a three-year high. ....(isn´t it funny that the fed under bernanke just eliminatet the m3 figure. the called it useless and to costly to collect..../ ist es nicht merkwürdig das die fed genau diese m3 geldmengenerhebung als nutzlos und zu kostspielig eliminiert hat...)

`Pretty Lavish'
Charles Dumas of Lombard Street Research Ltd. in London calculates that money supply in the world's top economies is growing at an annual rate of 7.5 percent. Though down from a four- year high of 9 percent a year ago, ``that's still pretty lavish,'' he says. ....

``Money supply on a global basis is growing quite rapidly as is overall credit growth,'' says Drayson, a former U.K. Treasury economist. ``We don't see much evidence that monetary policy around the world is restrictive.'' look at this!http://immobilienblasen.blogspot.com/2006/09/credit-machine-is-running-amok-mother.html

Revival of Monetarism
Other central banks including the Bank of England and the Bank of Japan are starting to share the ECB's view on money growth. That's a shift from a few years ago, when following money supply was deemed a relic of the 1970s. .....

One central bank that isn't joining is the Federal Reserve, which no longer sets a target for monetary growth and stopped publishing one measure of money supply in March. (what a surprise/welch überraschung!)

``The Fed responds to the effects of asset prices, not to the prices themselves.''

For central bankers, the threat is that overinvestment pumps up asset bubbles that lead to economic busts, just as the explosion of investment in U.S. technology companies did at the turn of the decade. (and now the same with housing/nun dasselbe mit dem immobilienmarkt)

Risky Investments
Available money is encouraging ``barely profitable and highly risky'' investments, French Finance Minister Thierry Breton said last month. The average interest rate of 10 leading economies adjusted for inflation is now around 2.8 percent, below the 3.2 percent average of the 1990s,...

The Bank of England, which once shared the Fed's skeptical view of money supply as a policy guide, is now grappling with the fastest expansion of money in 16 years. After raising rates a quarter point in August, citing ``rapid growth'' of cash and credit, Bank of England officials are signaling a further quarter point increase when they convene next week. .....

Worried Governor
Growth in M4,
the broadest measure of U.K. money supply, accelerated to 14.5 percent in September from 13.7 percent in the previous month, the Bank of England said today. ....

Cheap cash means China may also be overheating. The country last year had 118 million tons of excess steel production capacity, more than the 112 million-ton output of Japan, the world's second-largest steelmaker.
Industrial & Commercial Bank of China Ltd. this month completed the world's biggest initial public offering, raising $19.1 billion and attracting more than $500 billion in orders, equivalent to twice Citigroup Inc.'s market value.

``This was massively oversubscribed,'' says John Fildes, managing director of Instinet Pacific Services Ltd. in Hong Kong. ``There is a huge pent-up wall of money.''

Monday, October 30, 2006

India Raises Rate for Fourth Time to Curb lending/Inflation

mehr zu indien http://immobilienblasen.blogspot.com/2006/09/indien-bubble-world-tour.html


India Raises Rate for Fourth Time to Curb Inflation http://tinyurl.com/yej9u7

India's central bank increased a key interest rate for a fourth time this year as record economic expansion and lending stoke inflation.

Governor Yaga Venugopal Reddy raised the Reserve Bank of India's repurchase rate by a quarter-point to 7.25 percent. The central bank kept its reverse repurchase rate unchanged at 6 percent...

....India's central bank is increasing the cost of credit to curb inflation, which rose to a four-month high of 5.26 percent in the second week of October. Consumer prices paid by urban dwellers rose to a seven-year high of 6.6 percent last month, while prices paid by farmers gained to almost an By raising the repurchase rate at which the Resereight-year high of 7.34 percent...

By raising the repurchase rate at which the Bank lends overnight, the central bank is trying to increase borrowing costs in particular to housing and retail, the fastest growing banking segments, and slow near-record loans growth.

More Increases
The central bank has left unchanged the reverse repurchase rate, or its overnight borrowing rate, as it wants to maintain enough money in the banking system to support economic growth at the same time....( as if the money supply isn´t grwoing fast enough with close to 20%!als wenndie geldmenge nicht schon schnell genug wachsen würde...)

Money supply rises by 18.5% http://tinyurl.com/yzzjss

Lending Growth
Commercial banks' loans to companies have risen about 30 percent since April 1 from the same period last year, ...

ICICI Bank, India's most valuable, expanded loans by 47 percent in the third quarter from a year earlier, the Mumbai- based lender said Oct. 26. ICICI Bank and State Bank of India are ranked No. 2 and No. 3 among stocks on the benchmark Bombay Stock Exchange Sensitive Index since the central bank's last rate increase in July, both gaining about 50 percent as the Sensex has risen 25 percent.

Indian lenders may be moved to a higher risk category, Fitch Ratings said on Sept. 27, as unabated loans growth may lead to a ``systemic crisis'' in the banking industry.

India tops a global consumer confidence index of 40 biggest countries for the third year in a row in 2006, according to AC Nielsen Co., a New York-based market research firm. The South Asian nation's manufacturing production growth increased to almost a six-year high in August.

`Very Dynamic'
``India is really a story of a very dynamic domestic market,'' said Michala Marcussen, a strategist with Societe Generale Asset Management in Paris. ``The risk is the typical overheating scenario, very strong domestic demand leading to growing inflationary pressures and ultimately forcing the central bank to tighten significantly.'' ......

Remember What a 1% Decline Feels Like?

denke das nennt man denn auch überkauft, oder?......

i think we can call this a little bit overbought.........

wahnsinnschart von ticker sence! http://tickersense.typepad.com/ticker_sense/

At the start of the month, we postet that the S&P 500 had gone 55 consecutive trading days without a 1% decline. At the time it was the third longest stretch of the current bull market (10/9/02-present).

Since that prior post, the S&P 500 has yet to record a 1% one-day decline, and the streak now sits at 75 trading days. The chart below shows that the current streak is now the longest of the bull market and also the longest since way back in 1995


größer/bigger http://tickersense.typepad.com/photos/uncategorized/1declines1.jpg

bravo!


hussman on sp 500 valuation / bewertungen

this is quite and simple one of the best and most rational calculation i´ve hear the last time. it should be no surprise that all the media and wall street is still in the "cheap valuations" etc camp. unfortunalty they are basing their calculations on proforma 2007 earnings that are still rising with wider margins etc.......

das ist in eine der besten und rationellen berechnungsmethoden. kein wunder das diese nicht von den medien und wall street geteilt wird. die sind immer noch im lager drejenigen die sagen "der makt ist billig". dumm nur das deren schötzungen nicht auf kern sondern den berüchtigten proformagewinnen basiert und zudem unterstellt das 2007 die gewinne weiter wachsen und die margen sich weiter ausweiten.......

http://www.hussmanfunds.com/wmc/wmc061030.htm
Re-defining the standard of value

Let's talk about those fundamentals. Currently, the S&P 500 trades at over 18 times record earnings on record profit margins. Earnings for the S&P 500 are also at the top of the long-term 6% growth channel that connects prior earnings peaks going back nearly a century. Historically, when earnings have been anywhere near that 6% peak-to-peak trendline, the P/E multiple on the S&P 500 has averaged about 9 or 10.

Similarly, the S&P 500 trades at a price/revenue ratio of about 1.5 currently, compared with a ratio that has historically fluctuated between about 0.5 and 1.0, with an average of about 0.8. With few exceptions, the valuations that we've observed over the past decade are valuations that have only been observed over the past decade.

So shouldn't we “adapt” our valuation measures to reflect the higher level of recent valuations? More generally, rather than looking at say, the price/peak earnings multiple on the S&P 500, wouldn't we get a better measure of valuations if we adjusted that ratio based on its average level over the most recent decade or so?

Short answer: No.......

..... That said, suppose we allow for the possibility that 18 is the new 11. Historically, the price/peak earnings multiple on the S&P 500 has had a median of 11, a level that we observed, for example, at the 1990 market trough. But suppose that valuations simply deserve to be higher here. Suppose the current P/E of 18 is “just right” (Cough). Well, even in that case, we would still expect stocks to fluctuate around that norm over time.

Suppose then, that earnings continue to grow along their peak-to-peak growth trend of 6%, but that perhaps 4 years from today the P/E on the S&P 500 will briefly dip to 16 times those future record earnings.

Well, let's do the math. Given the current dividend yield of 1.8%, the annualized total return on the S&P 500 over that 4-year period would be just [(1.06)(16/18) ^1/4 + .018(18/16+1)/2 – 1 = ] 4.84%. That's still less than T-bill yields or 4-year Treasury yields. (i think this calculation doesnt´t include the buybacks/denke das hier die buybacks nicht eingerechnet sind)

In other words, it's not enough to argue that “the standards of value have been raised.” Unless investors are also willing to assume that the market will no longer fluctuate around those standards, it's very difficult to conclude that stocks are priced to deliver satisfactory long-term returns.

There is, in my view, no compelling evidence to support such a change in the standard of value. What we do observe is a market that has attained high multiples on record profit margins, and now requires the permanent maintenance of both in order to achieve even moderate long-term returns. ....

Adding to the general impression of an overextended stock market, Vickers notes that corporate insiders of stocks traded on the NYSE ramped up their selling activity last week to 7.81 shares sold for every share bought. On the Nasdaq, the insider sell/buy ratio shot to 6.36. Both ratios have more than doubled over the past few weeks. One wonders, if corporate insiders have so little optimism about their own shares, why should investors?

still a good time to buy.......?

Europe Faces Infection From U.S. Home-Price Fall

die studie auf die sich der autor bezieht kann hier in voller länge eingesehen werden
http://immobilienblasen.blogspot.com/2006/10/db-research-usuk-ie-esp-fra-dk-ger.html

the full study from deutsche bank the writer is refering to can be viewed here in full lenghth
http://immobilienblasen.blogspot.com/2006/10/db-research-usuk-ie-esp-fra-dk-ger.html

mehr/more on the "bubbel world tour"
http://immobilienblasen.blogspot.com/2006/09/bubble-goes-global.html

Europe Faces Infection From U.S. Home-Price Fall
http://tinyurl.com/yctrrg


Oct. 30 (Bloomberg) -- In the last decade, real-estate prices in Europe have moved in one direction -- up. (not germany! / nur deutschland nicht)

That may be about to change. In the U.S., a booming property market has stalled. Plenty of people think it may be facing a full-scale crash. If that happens, it would be complacent to assume that Europe could avoid the fallout.

In the past 10 years, Spanish property values have more than doubled, while home prices have tripled in the U.K. and quadrupled in Ireland, ....

House-price growth across the region has moderated this year, according to real-estate advisers Knight Frank LLP. Residential-property values in France gained 9.4 percent last year, compared with 15 percent in 2004, while Irish prices rose 9.4 percent in 2005 versus 10.1 percent the previous year.

In both countries, Knight Frank predicts prices will increase 7.5 percent next year, very healthy when you consider the gains already made. The emerging economies of eastern Europe will experience the most dramatic growth, with Lithuanian values expected to expand 20 percent next year, while Latvia and Slovenia won't be far behind.

Even the perennially disappointing German market is expected to have modest price gains (2,5% 2007e) as it emerges from a prolonged economic decline

In the U.S., however, the outlook is a lot cloudier. (really an understatement!/untertreibung)

Impact on Europe
There is room for debate about the scale and duration of the decline. Yet nobody would dispute that the market is falling.

The issue is whether a slowdown in the U.S. will infect Europe. Not everyone thinks so. ....

Others aren't so sure. In a recent note, Deutsche Bank analysts Tobias Just and Stefanie Ebner said there was a serious risk of ``contagion'' between the two markets.

The U.S. has very different demographics from most of Europe. Yet there are four reasons to think that a decline in U.S. real estate will be bad news for Europe.

`Similar Growth Pattern'
First, history tells us that the two markets generally move together. ``Over the past 20 years, most housing markets on both sides of the Atlantic followed a similar growth pattern,.....

``Considering all these interdependencies, European markets might well be affected by the slowing U.S. housing market.'' Just as European and U.S. equity markets tend to follow the same cycle, it turns out property markets do as well. The relationship has held in the past -- and there is no reason why it shouldn't this time around.

Next, valuations are stretched in Europe just as they have been in the U.S. market. With the exception of Germany, house prices have been increasing much faster than wages at a time of slow European economic growth. In countries such as Spain and Ireland, house-price growth rates have been matching those of the U.S. market. Many people are getting priced out of the market -- eventually that will reduce home values.

Third, the European Central Bank may not have been raising borrowing costs as fast as the U.S. Federal Reserve, yet it has boosted its benchmark lending rate five times since December to 3.25 percent and shows few signs of stopping. The capital markets are global. As money gets more expensive it will restrict European home buyers as much as U.S. property purchasers.

U.S. Recession?
Finally, a U.S. housing decline could help cause a recession around the world. If that happens, it will hurt European real- estate prices. More broadly, a dip in the U.S. will damage confidence, and the property market is reliant on sentiment. If people think prices will drop, they almost certainly will.

In the medium term, house prices depend on how much money people can afford to borrow and whether they have employment. A drop in global economic growth and rising interest rates would make it impossible for European real-estate prices to continue their gains of the past few years.

With the U.S. market cooling, the times of unbridled price increases in the European home market will soon be over.


Behind Dow 12,000, an economy at risk / fleckenstein

Don't let the soaring Dow industrials fool you. Sober experts' predictions include big trouble ahead for the stock market and the housing market, and possibly a recession.
http://tinyurl.com/y8mb24

These days, it's hard for any sober thoughts regarding risk, the stock market or the housing market to be heard over the din of "Dow 12,000." In that vein, I'd like to share a few views that I find interesting.

Mamis: His rapier wit finds its mark
Longtime market observer Justin Mamis this week opined: "It's clear that the (stock) market is tired, and there's a possibility that this is sufficiently 'it.' ....."

Next, Mamis mused on a remarkable phenomenon that occurs in the dead-fish/corporate community: "Isn't it peculiar that the consensus misses are so lopsidedly 'under'? Good thing we don't understand what fundamental analysts do at their desks, or else we might suspect that the analysts and the companies are in cahoots to underestimate so they can report 'better than expected' results. After all, 71% is too high a percentage not to be suspicious of something."

Continuing on, he took aim at Bubblevision: "These gripes suggest that anyone who watches such matters unfold on CNBC has a less than even money chance of learning something useful. Indeed, we'd say the odds are 2 to 1 against. And, if one watches with the sound on, the chance of being uselessly informed about some company or other (and/or the short-term market direction) would be more like 4 to 1. And, if we counted being 'late' as also being 'useless,' make that 10 to 1." (good one!)


.....Rubin on risk,
the uninvited guest In a more serious vein, I'd like to quote further from Citigroup's interview with former Treasury Secretary Robert Rubin. I'll begin with his assessment of risk:

"Sandy Weill (the former Citigroup chairman) made a good comment to me. Nobody's going to ring a bell to tell you, but someday you may wake up and find out that these risks have materialized."

Rubin observed that many people seem to think the risks that do exist won't matter in the short run. Therefore, they're fully invested -- "because that's not their time horizon in calculating an expected value. … Also, some assume that they can get off before the music stops. You know, not everybody is going to get off before the music stops."

Selective vision earns derision
Continuing on, Rubin made an important point about the macro/stock-market environment: "I think there's been a curious phenomenon in the equity markets, at least in the last few months: When there is news that the U.S. economy is slowing, the market often gets stronger because investors figure the Fed will stop raising rates, or maybe lower rates -- or maybe they think bond yields will decline. For some reason, they don't seem to say to themselves that earnings may be lower. I think it's very strange."

Next, he shared his views on the dollar: "You have to figure out some way -- which I have not done, I might add -- to protect yourself should we have a real currency problem here. (He makes a number of points about why that could occur.) I'm not saying what the odds are. I have no idea. Maybe the odds are very low. But that is one concern."

Levy: When subprime's time is up
Now for one man's view of the post-housing-bubble era, as described by David Levy of the Jerome Levy Forecasting Center. ....

Levy said: "Eventually, lenders are going to be forced to tighten standards, which will only intensify problems in the housing market, increase the drag on consumer spending, and worsen household debt loads. That, I'm afraid, will amount to a vicious cycle, leading to a recession and prolonged credit crunch."

When financial dark matter finally matters
"The other issue is the fact that the concept of distributing risk, more broadly -- the idea that financial innovation protects us from risk -- is only partly true. And, in one sense, is exactly wrong. It is true that derivatives increase the tolerance for problems, much in the same way that when you link together several mountain climbers on the mountain, you reduce the risk that one will fall to his doom.

"However, the overall risk increases because of this sense of security. Eventually, you get to the point where, in essence, the mountain climbers have climbed higher and higher onto more and more slippery slopes. So, you have more than one or two fall together, dragging the entire party down." Yes, I think that financial dark matter has been the glue that's held together the housing market and the economy.

As for folks' belief that there aren't any problems, and what may come next, Levy made another fine point: "It's just human nature to believe more strongly in a trend the longer it continues. So, what happens when an unsustainable trend continues is that people find more and more reasons to believe that it's not unsustainable."

Ladies and gentlemen, that description encapsulates not just the stock market but also folks' wrongheaded conclusions about the housing market: that the decline is behind us and we're on course to better times.

Of prudence and pain avoidance
I don't see how anyone with a modest amount of intelligence or knowledge of history can conclude that this is not one of the more dangerous times our economy has seen. It's my belief that these comments from Rubin and Levy, among others that I could share, offer serious food for thought -- which folks ignore at their peril.


Sunday, October 29, 2006

quote of the day / zitat des tages

dank geht an david.

er hat im übrigen ein ganzen blog nur den wahnwitzigen zitaten dem chefverkäufer der maklervereinigung gewidmet. http://davidlereahwatch.blogspot.com/


this is from peter schiff http://www.europac.net/

"If the National Association of Realtors chief economist David Lereah had covered the arrival of the Hindenburg in New Jersey in 1937 (instead of Herb "Oh the Humanity" Morrison) it too may have been described as a 'soft landing.'"

mehr von davin lereah

http://immobilienblasen.blogspot.com/2006/08/bagdad-bob-lebt.html, http://immobilienblasen.blogspot.com/2006/09/erben-von-blodget-meeker-cohen.html

die volle dosis hier / plus the full dose http://davidlereahwatch.blogspot.com/

Slow road ahead / economist

klasse zusammenfassung warum die usa zukünftig probleme bekommen werden.

fantastic summary why the best times for the us economy as a powerhouse are at least for the next few year are over

America's long-term potential rate of growth is falling, perhaps to its lowest pace in over a century
http://www.economist.com/business/displaystory.cfm?story_id=8079134


EVERYONE knows that America's economy is slowing. Thanks to the bursting of the housing bubble, overall GDP growth has fallen back sharply. The biggest short-term uncertainty for the world economy is whether American consumers stop spending and drag the country into recession. But beyond the business cycle, another slowdown has received scant attention. America's potential rate of growth—that is, the pace at which annual output can expand without pushing up inflation—is also falling. By some estimates, it could drop to 2.5% over the next few years, which would be the slowest pace in over a century.

If that happens, the consequences will be serious. Tax revenues will grow more slowly than expected. Monetary policy will become harder to manage: as the 1970s showed, inflation can get out of control if central bankers do not realise that an economy's speed limit has fallen. Financial markets will be disturbed as conventional wisdom adjusts from an assumption of 3-3.5% potential output growth, and investors downgrade their expectations. (i bet that some spinning will be at works/gehe jede wette ein das neue statistiken adjustiert werden um dinge besser aussehen zu lassen)


Potential output is hard to estimate, let alone predict......Over the long run economic growth depends on two things: increases in the supply and productivity of labour. The growth of labour supply, in turn, depends on the growth of the working-age population, the proportion of people who work and the number of hours they put in. The pace of productivity growth depends on capital investment, improvements in business processes and technological innovation.....


.... this kind of “growth accounting” is fraught with difficulty. Both labour supply and productivity growth bounce around during business cycles. ........ Productivity growth is usually higher at the beginning of an expansion than at its end as firms work their existing employees harder before hiring new people. As a result, potential output can temporarily diverge from its underlying trends, making it even harder to estimate.

....... After the 2001 recession, productivity growth accelerated again, while the growth of labour supply slowed sharply. The share of working-age Americans in jobs fell after rising almost continuously for over four decades (see chart 1). This fall was widely interpreted as temporary, a sign that the recession was deeper than it appeared. But after five years of expansion, it has not been reversed, suggesting (although the evidence is still tentative) that structural changes are afoot. These labour-markets shifts are the main reason to be pessimistic about America's potential output growth.


So why is the proportion of Americans who work falling? For three reasons.

First, the baby-boomers are heading towards retirement. The share of people aged between 55 and 64 has risen from 10.5% in 1995 to 13.3% in 2005 and is likely to reach over 16% by 2015. People over 55 tend to work much less than younger folk.

Second, the rush of women into the workplace has stopped. The proportion of women working rose from below 40% in 1960 to a peak of over 60% in 1999. It has subsequently fallen slightly.

Third, the rate of teenage employment has plunged. In the 1990s over 50% of young people aged 16-19 had jobs. Today just over 40% do, the biggest drop since records began. This decline is a bit of a mystery, since job growth in the kinds of industries that tend to employ young people—restaurants and shops—has been well above the national average. It may have happened because teenagers are staying at school or college longer, and are working less on the side. More education may mean higher future productivity, but in the medium term it cuts the number of available workers.(lets hope that they all can get a job that is close to thier education (offshoring etc)/ man kann nur hoffen das all die studierten auch in den usa einen angemessenen job finden und nicht mehr outgesourced wird....) http://immobilienblasen.blogspot.com/2006/10/mother-of-all-revisions-mutter-aller.html

..... America's trend rate of labour-force participation could drop by a further 1.4 percentage points in the next four years, to just over 64%. ..... By 2010, the Fed economists reckon, labour supply in America will be rising by a mere 0.4% a year, well under half its current rate.

The geezer difference
These projections could be too gloomy..... An unexpected jump in what Dick Berner of Morgan Stanley calls the “geezer labour force” could make a difference as ageing baby-boomers work longer. Men in their 60s are already the fastest-growing segment of the workforce, although this has not made up for the overall decline. ( i bet that the main reason is that their retierementfundings are not sufficient....../liegt wohl an erster linie das ihre rentenvosrorge zu niedrig ist.....)


A rise in immigration could increase the supply of labour, too, particularly since the proportion of immigrants who work is higher than that of native-born Americans. .....

It seems very likely, then, that America's labour supply will grow more slowly. And if that happens, potential output growth will too, unless productivity growth accelerates.

Unfortunately, the latest evidence suggests that, if anything, productivity growth is slowing unexpectedly. Over the past two years, in the non-farm business sector, it slowed to an annual average of 2% from an average of almost 4% in the previous three years. /50%!

And even that figure may be too high. The Bureau of Labour Statistics recently said 810,000 more jobs were created between March 2005 and March 2006 than they first thought. Thanks to those extra jobs the productivity figures for 2005 may be revised down by a further half of a percentage point. For the economy as a whole, the figure is some 0.3-0.5 percentage points lower than the official productivity figures suggest, because productivity growth in farming and government, which are left out of those figures, is even lower.


The longer the economy's expansion goes on, the slower productivity growth is bound to be. But the pace of the deceleration has begun to raise concerns. ......over 60% of the late 1990s productivity surge was related to information technology. .....

The 2001-04 productivity surge is now the focus of an argument with big implications. Only 30% of that acceleration was related to IT, ....

the post-2001 acceleration was the result of cost-cutting, not innovation. Other economists note that the pace of investment, particularly in IT, is much lower than it was in the 1990s. JPMorgan's calculations, for instance, show that firms' spending on IT equipment has grown by only 5.5% a year in this expansionary period, compared with over 20% a year in the late 1990s. Lower capital spending, they fear, could be a harbinger of slower productivity growth. . worries that high oil prices may also have hurt underlying productivity growth,.....

Mr Gordon sees the underlying rate of business productivity growth slowing to below 2.5% which, by his calculations, implies a rate of 2.1% for the overall economy. Coupled with the slowdown in labour supply, he concludes that America's potential growth rate could fall to 2.5%. ....

Mr Gordon's calculations suggest that 2.5% would be America's slowest economic speed limit in over a century (see chart 2).


Since no one foresaw the productivity revolution of the mid-1990s, these predictions could prove too pessimistic. The next “killer application” could be just around the corner. Even without rapid investment, the IT revolution may yield more productivity gains. But without some such happy chance, it looks as though America's potential growth rate is heading for a slowdown, at least for the next few years.


The sooner that investors and policymakers wake up to this, the smoother the adjustment is likely to be.

wall street at work........ / cartoon

dank geht an john prichett


Saturday, October 28, 2006

even usa today is waking up

dieselben mediean haben noch vor 12-18 monaten ohne mit der wimper zu zucken den immobilienmarkt als todsichere sache gepriesen.

the same kind of media has promotet real estate just 12-18 month ago as a bulletproofed investment or the perfect time to buy.

Sellers sing the blues as price drop sets record


größer/bigger http://images.usatoday.com/money/graphics/existing_home_sales/home_sales_topper.gif

if you want to read the relatet story to the graph http://www.usatoday.com/money/economy/housing/2006-10-25-home-price-usat_x.htm

even the 1.6 gdp is overstatet !

so sieht also unter anderem die wirtschaft aus die angeblich immer noch "stark" ist. zumindest wenn man 99% an wallstreet und 90% aller medien auch in unserem land glauben mag. abseits der "spin"versuche ist die lage fast überall dramatisch.

vergleicht bitte mal diesen bericht mit den schlagzeilen der letzten wochen aus allen medien und stellt diese gegenüber. ich probiere das in diesem blog in erster linie bei den us immobilienstatistiken. ich kann euch aber versichern das diese "hurra"meldungen spätestens nach der 2 nicht mehr beachteten revision alle regelmäßig schlechter ausfallen (mal ganz abgesehen von den teilweise recht zweifelhaften erhebungsmethoden).

compare this news with all the spin that you hear and read from 99% of wall street and 90% of the media.
beneath the spinning the reality on main street is ugly.


U.S. Data Fluke Exaggerated Growth, Will Be Reversed http://tinyurl.com/y4gtlp

Oct. 27 (Bloomberg) -- An unexpected increase in auto production last quarter was a statistical fluke that will be reversed, making current U.S. economic growth even weaker, according to a former Commerce Department economist.

Last quarter's annualized 26 percent increase in motor vehicle production shocked Joe Carson, now director of economic research at AllianceBernstein LP in New York. Without the gain, the economy would have grown at an annual rate of 0.9 percent, not the 1.6 percent the Commerce Department reported today.

The reported increase in output came despite cutbacks announced by General Motors Corp., Ford Motor Co. and others. A drop in the wholesale price of SUVs and light trucks as the automakers cleared leftover 2006 models made production look stronger than it actually was, said Carson. The economic fallout from the auto-industry cutbacks will instead come this quarter, he said.

``Last quarter was weak even with the benefit of this mismatch and the fourth quarter will now also be weak because it's going the other way,'' Carson said. ``Whatever output you have this quarter, which will probably be down, will be discounted by a likely rebound in prices.'' .....

Growth Pessimism
Carson currently forecasts the U.S. economy will grow at an annual rate of 1.4 percent this quarter and said he wouldn't be surprised if growth came in at half that pace. .....

Carson wasn't the only economist shocked by the auto- production figures.

Stephen Stanley, chief economist at RBS Greenwich Capital in Greenwich, Connecticut, called the numbers ``the most unbelievable detail'' in the GDP report. .....

Composition of Growth
The composition of growth last quarter, which included an unexpectedly large accumulation of inventories, also prompted other economists to reduce estimates for fourth-quarter growth. An increase in inventories overall suggests manufacturers may need to trim production this quarter.

The economy will probably grow at an annual pace of 1 percent from October through December, ......

Ford, the second-biggest U.S. automaker, said car and light truck sales dropped 17 percent last quarter compared with the same period last year. The Dearborn, Michigan-based company cut third-quarter production by 11 percent, and plans to slash output by 21 percent this quarter (of course this news with e record loss and acounting errors back to 2002 pushed shares almost up 8%!/diese tollen news plus mrdverluste und bilanzierungsprobleme bis ins jahr 2002 haben die aktie 8% stiegen lassen.)

more on the gdp and housing
http://immobilienblasen.blogspot.com/2006/10/gdp-and-housing.html


Friday, October 27, 2006

gdp and housing

this is from roubini

The weakness in Q3 growth is widespread: real residential investment fell at an annualized rate of 17.4%, much worse than the 11.1% drop of Q2;

Even non-residential investment in structures that was growing at an annualized rate of 20.3% in Q2 slowed down its growth to 14% in Q3: you can expect a much sharper slowdown in such non-residential investment in Q4 and 2007 (the next bubble in the making...)

make sure you read this piece from mike larson about commercial real estate !!!!!!
!
http://www.moneyandmarkets.com/press.asp?rls_id=433&cat_id=6

make sure you see the coverage with great graphs!!! from paper money
http://paper-money.blogspot.com/2006/10/report-heard-round-world.html
http://paper-money.blogspot.com/2006/10/hey-big-spender.html

plus a must see graph from calculatet risk that shows how much room to fall there is
http://calculatedrisk.blogspot.com/2006/10/residential-investment-as-of-gdp.html

the full piece on all aspects of the gdp numbers here
http://www.rgemonitor.com/blog/roubini/154353/

Global Trading Ranges / overbought vs oversold

wow! dank/thanks to http://tickersense.typepad.com/ticker_sense/

As our overbought/oversold charts show below, most global indices are trading above the top end of their normal trading ranges. Spain, Singapore and Mexico are the closest to their theoretical highs while Malaysia's ETF is the only one that is close to being oversold

größer/bigger http://tickersense.typepad.com/./photos/uncategorized/globalobos1027.jpg

where housing is headed

Boom! Bust! Boom? / history of housing busts business week

i think that the comparisson business week to other busts is a little bit too optimistic.
why? just look at the chart from shiller that shows you that this bubble is by far more dramatic than the previous busts.

but bw does a really good job on showing that "inflation adjustet" some areas never recover for decades.

bin der meinung das die schlüsse der bw noch zu optimistisch sind. guckt euch nur den chart von shiller an und ihr seht wieso.


Check the history of housing busts. Some areas bounce back more strongly than others
http://tinyurl.com/ylnuab

Housing has gone from a sure thing to a complete muddle. Median prices fell nationwide for a second straight month in September, the first time that has happened since 1990, according to a report on Oct. 25. Homeowners don't know whether to sit tight or bail. They have no idea whether they're experiencing the beginnings of a deep bust that will leave a permanent hole in their wealth, or a small hiccup.

There's a lot to learn from history
. While national downturns in home prices are rare, we have plenty of experience with busts in local markets. Remember, many regions that have been strong in recent years, such as New York, Boston, and Los Angeles, were mired in slumps in the early or mid-1990s. People who bailed out of them at the bottom are still kicking themselves or blaming their ill-informed spouses.


How common is this boom-bust-boom pattern? Over the past three decades about 40% of housing busts in big metro areas have eventually been followed by strong recoveries. That's according to a BusinessWeek analysis of inflation-adjusted housing prices. In an additional 15% of markets, prices adjusted for inflation barely got back to their previous peaks after 15 years. In the remaining 45% or so of markets, prices adjusted for inflation were still down a decade and a half after their pre-bust peaks.

The disparity between winners and losers was striking: Among the winning markets, the average inflation-adjusted gain after 15 years was 43%, while among the losers the average inflation-adjusted loss was 19%.

How do you know if your own local market is the kind that will snap back or the kind that will languish indefinitely? One key factor is the ease or difficulty of building new homes. ....

If the supply-side analysis is correct, it has scary implications for markets like Miami, Phoenix, and Las Vegas, where prices have zoomed in the past several years. Because it's easy to keep up with rising demand by building housing in those areas.....

Moody's Economy.com Inc. has a projection of house prices out to 2015 that shows most of the biggest 10-year gains in apparently cheap markets such as Pittsburgh, Nashville, Houston, St. Louis, and Austin. The forecaster projects small gains for expensive markets including San Diego, Los Angeles, Las Vegas, New York, and Washington.

Economy.com's approach is consistent with textbook economics. But it would have done a bad job of predicting what happened in the past 10 years, wherein the pricey got pricier and the cheap cheaper. For example, even though Houston has had a long stretch of healthy growth, it's so easy to build homes there that inflation-adjusted prices are still 19% below their 1983 peak.

With apologies to the mainstream, the truth is that supply considerations can cause markets to diverge from what seem to be the fundamentals for a long time, perhaps permanently. One explanation for this is the "superstar cities" concept developed by economists Joseph E. Gyourko and Todd M. Sinai of the University of Pennsylvania's Wharton School and Christopher J. Mayer of Columbia Business School. They argue that certain cities -- Boston and San Francisco, say -- benefit from a winner-take-all phenomenon that separates them from also-rans. People all over the world want to own homes in Boston and San Francisco, and the supply is limited. As worldwide wealth rises, there is a bidding war for homes there. No such luck for, say, St. Louis. In fact, according to the authors, the gap between prices in San Francisco and the national average doubled between 1970 and 2000.


größer/bigger http://images.businessweek.com/mz/06/45/0645_66econom_a.gif

In an era of globalization, cities with international reputations can get an edge over blander neighbors if they're perceived as scarce commodities. ..... Miami developers have parlayed the city's international fame into booming sales of condos to Latin Americans and Europeans. But while the uniqueness phenomenon may help growth in those cities, it won't necessarily keep prices up, because it's easy to build: Witness the current glut of Miami condos.

What makes the housing supply inflexible in markets like Boston isn't necessarily a lack of land. Far more often, the cause is regulatory constraints like minimum lot sizes. ......


At this stage in the slump, restricting the supply of housing may sound like a good thing. It's not. Sure, it can make current owners richer by increasing the scarcity value of their homes. But it's murder on first-time buyers. And in the long run, it's bad for the local economy. .....

best city
New York
Previous bust?
Yes, 1992-95 Pre-bust peak: 1988

Inflation-adjusted prices 10 years after pre-bust peak: -25%
Inflation-adjusted prices 15 years after pre-bust peak:+10%

worst city
Cleveland
Previous bust?
Yes, 1982-84Pre-bust peak: 1979

Inflation-adjusted prices 10 years after peak:-19%
Inflation-adjusted prices 15 years after peak: -13%

more details on other cities http://images.businessweek.com/ss/06/10/housing_markets/index_01.htm

china bubble watch

wie nachhaltig die geschichte in china ist werden wohl erst die nächsten jahre zeigen. fakt ist das dieser spieler so oder so der entscheidende faktor für die nächste decade sein wird. ich empfehle jedem undebigt die anderen geschichten über china zu lesen (besonders shanghai) http://immobilienblasen.blogspot.com/2006/08/bubble-in-china-shanghai.html

it will be interesting to see how china will perform the next few year. either way you look at china, it will be main force that drives the market up or down. i recommend to read the piece about the bubble in shanghai. http://immobilienblasen.blogspot.com/2006/08/bubble-in-china-shanghai.html
China's Property Curbs Fail to Cool Investment Growth
http://tinyurl.com/y2adw6

Investment growth in China's real estate industry accelerated in the first nine months of the year

Property investment rose 24.3 percent, or 2.1 percentage points faster than a year earlier..... Growth picked up from 24 percent through August.

The government's measures including restricting land supply and lending and imposing new taxes have failed to cool investment and property prices that more that doubled since 2000. Property prices in China's 70 major cities rose 5.5 percent in the third quarter from a year earlier.... Shanghai is the only city where property prices have fallen, the survey showed.

In the first nine months, property investment rose to 1.29 trillion yuan ($163 billion), mainly boosted by investment in residential projects, which rose 29.5 percent. Investment growth in the residential market, the target of the central government's policies, was 8 percentage points faster than a year earlier, the release said

China's developers put 18.9 percent more apartments and offices under construction in the first nine months, covering a total of 1.6 billion square meters (17.2 billion square feet).

Local Resistance
Premier Wen Jiabao moved to restrain the property boom amid concern that it might turn into a bubble and trigger an eventual collapse in prices. A housing bust could hurt social stability and derail the world's fastest-growing major economy, analysts said

``Real estate investment has helped local governors build up city images and pave way for personal development,'' said Wayne Zane, a director of property consultant Colliers International in Shanghai. ``That's encouraged local officials to resist the central government's attempts to cut land supply and investment. http://immobilienblasen.blogspot.com/2006/08/china-steuert-erneut-gegen.html, http://immobilienblasen.blogspot.com/2006/08/china-erhht-erneut-zinsen.html, No one wants to be the first to fully apply the central government cooling measures as they're afraid of losing investment to rivals.'' (it is the same as with plants etc. sometimes it feels like the gouverment in peking has lost control.../ dasselbe passiert mit diversen industrieansiedlingen. manchmal hat man das gefühl als wenn peking die kontrolle verloren hat....)

Shanghai Scandal
The economy in Shanghai, one of China's richest cities, expanded almost 60 percent in the three years through 2005 as property prices more than doubled.


Former Shanghai Communist Party Secretary Chen Liangyu attained the position of Politburo member after building the city into China's financial hub and helping secure the right to host the 2010 World Expo. Chen was fired last month for his role in misuse of the city's pension fund, part of which was diverted to real estate projects.