credit machine is running amok / mother of all bubbles
ich weiß das dieses ein sehr langes posting ist. um zu verstehen was z.zt. an den märkten abgeht sollte man sich dieses trotzdem ganz genau durchlesen. ich denke nach der lektüre wird man die ein oder andere bewegung an den märkten wesentlich besser nachvollziehen können.
die frage aller fragen ist was beeinflußt die assetmärkte am stärksten. meiner meinung nach ist mit abstand an erster stelle der zugang zu kapital/liquidität/krediten und alles was in diesem themenkomplex fällt zu nennen.
unter anderem ja auch ein grund warum die aktienmärkte immer gebannt auf die bondmärkte schauen.
was passieren kann wenn diese versorgung nicht gewährleistet ist kann man schön an allen krisen der letzten jahrzehnte sehen (japan, asienkrise, russlandkrise, ltcm krise etc).
problematisch bei diesem themenkomplex ist das ein großteil dieser krisen immer durch ein vorgelagertes extrem stares kreditwachstum begünstigt worden ist.
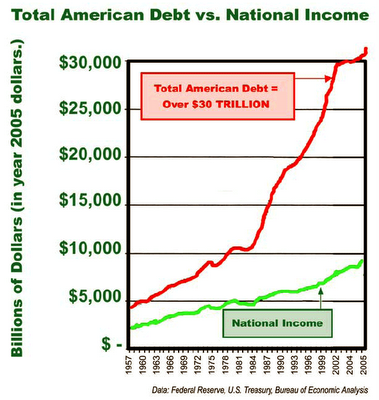
meiner meinung nach befinden wir uns zumindest was die usa angeht erneut in einer mehr als brenzliches situation. als belegt einmal diese statistik:
in Q1 2006, $7.50 of additional debt was added to the US economy for each dollar added to real GDP growth, despite the Fed's 16 rate hike
http://immobilienblasen.blogspot.com/2006/08/us-kreditproduktion-luft-amok.html
A TIGHTENING FARCE by Dr. Kurt Richebächer
http://www.dailyreckoning.com/Issues/2006/DR091306.html
The trouble in the U.S. case is that there never was any monetary tightening. There were many small rate hikes, and the Greenspan Fed had probably hoped that the higher costs of borrowing would exert some restraint on credit demand. But it has not happened. It was a vain hope.
The fact is that the credit expansion has sharply accelerated during these two years of rate hikes instead of decelerating. During 2004, when the Fed started its rate hike cycle, total credit, financial and nonfinancial, expanded by $2,800.8 billion. In the first quarter of 2006, it expanded at an annual rate of $4,392.8 billion
Over the two years of so-called monetary tightening, the flow of new credit has effectively accelerated by 56%. In 2005, credit growth was $3,335.9 billion. Over the whole period of rate hikes, it had steadily accelerated from quarter to quarter. Borrowers and lenders, apparently, simply adjusted to the higher rates, trusting that there would never be serious tightening.
True monetary tightening would have to show first of all in declining "excess reserves" of banks relative to their reserve requirements. These have remained at an elevated level during the rate-hike years of 2004-05
In 1991, when the Fed tightened, credit expansion slowed sharply from $866.9 billion in the prior year to $620.1 billion. A sharp slowdown in credit expansion in 2000 to $1,605 billion also happened, from $2,044.7 billion the year before. Yet this still represented very strong credit growth in comparison with the years until 1997.
Like all central banks, the Federal Reserve has two levers at its disposal to stimulate or to retard credit and money creation. The big lever is its open market operations, buying or selling government bonds, thereby increasing the banking system's liquid reserves. The little lever consists of altering its short-term interest rate, the federal funds rate, thereby influencing the costs of credit.
True monetary tightening has to show inexorably in a slower credit expansion throughout the financial system. There is one sure way for a central bank to enforce this, and that is by curtailing bank reserves through selling government bonds.
The other lever at its disposal, as pointed out, is to influence credit costs. But the influence of the central bank on credit costs begins and ends with altering its short-term federal funds rate. During the past two years, the Fed has raised its federal funds rate from 1% to 5.25%. But long-term rates hardly budged. To the extent that borrowers shifted from the low short-term rate to the long-term rate, they encountered higher borrowing costs. But at the long end, interest rates rose less than the inflation rate.
Here are still a few other credit figures illustrating the Fed's monetary tightening since mid-2004. Total bank credit expanded, annualized, by $957.0 billion in the first quarter of 2006, against $563.5 billion in 2004. For security brokers and dealers, the two numbers were $611.3 billion, against $231.9 billion; and for issuers of asset-backed securities (ABSs), they were $663.3 billion and $322.6 billion. This is monetary tightening à la Greenspan.
Monetary tightening has one purpose: to curb credit expansion fueling the excess spending in the economy and the markets. By this measure, Greenspan's monetary tightening since 2004 has been a sheer farce. During these two years, he presided over a sharply accelerating credit boom, for which the reason is also obvious.
It can be argued that rate hikes in the past have generally worked. Yes, but the central bankers of the past never forgot to tighten bank reserves. Tighter money to them meant tighter credit, and it always showed in sharply shrinking credit figures. So it also has, in the past, in the United States. But this time, the diametric opposite has happened.
von prudent bear / doug noland
http://www.blogger.com/post-create.g?blogID=30868010
Year-to-date, Bank Credit has expanded $508 billion, or 9.5% annualized. Bank Credit inflated $631 billion, or 8.5%, over 52 weeks (down on week)
Commercial & Industrial (C&I) Loans have expanded at a 15.2% rate y-t-d and 13.9% over the past year (down on week)
Real Estate loans have expanded at a 9.7% rate y-t-d and were up 10.2% during the past 52 weeks (down on week)
Total Commercial Paper jumped $18.3 billion last week (7-wk gain of $92.5bn!) to a record $1.882 Trillion. Total CP is up $241 billion y-t-d, or 20.1% annualized, while having expanded $276 billion over the past 52 weeks (17.2%).
“The global credit-derivatives market has more than doubled in the past year to $26 trillion
The global credit derivaties market is expected to grow to more than $33,000bn by the end of 2008,
Total Non-Financial Debt growth did slow from the first quarter’s torrid 9.5% rate down to 6.4% seasonally-adjusted and annualized
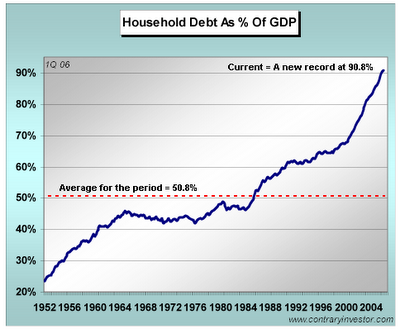
It is worth noting however, that federal government borrowings declined 2.4% SAA during the quarter, a sharp reversal of Q1’s 11.3% increase. At 9.1%, Total Household Borrowings remain robust, although down somewhat from the first quarter’s 9.6%. Corporate debt growth slowed to 6.7% from the previous quarter’s 8.8%, while State & Local borrowings accelerated from a 3.5% rate to 6.6%.
For one, Financial Sector Credit Market Borrowings actually accelerated – rising from Q1’s 8.6% pace to a notable 10.2% SAA. This confirms that financial conditions remain extraordinarily loose, as well as suggests that expectations for weaker economic activity only promote greater financial sector leveraging and speculating. In nominal SAA dollars, Financial Sector Credit Market Borrowings expanded at a $1.342 TN pace, up from Q1’s $1.110 TN and Q2 2005’s $1.171 TN. By major instrument category, “Open Market Paper” expanded at $309 billion SAA (18.0% annualized) to $1.475 TN; “GSE Issues” $300 billion SAA (11.5% annualized) to $2.686 TN; “Agency- and GSE-backed Mortgage Pools” $308 billion SAA (6.5% annualized) to $3.814 TN; and “Corporate Bonds” $406 billion (9.7% annualized) SAA to $4.559 TN.
Over the past year, Financial Sector Borrowings increased 9.1%. By Instrument, Open Market Paper expanded 21%, GSE Issues 3.9%, Agency MBS 6.9%, and Corporate Bonds 11.5%. It is worth noting that the pace of Financial Sector Borrowings over the past year has been more than double that of M2 growth (4.4%)
Banking Assets expanded at a SAA $941.4 billion during the quarter to $9.771 TN. For comparison, Bank Assets expanded $350 billion during 2001, $477 billion in 2002, $507 billion in 2003, $748 billion in 2004, and $763 billion during 2005. Bank Credit expanded at a blistering 11.8% pace during the quarter to $7.894 TN, up from Q1’s 11.3% and Q2 2005’s 9.5% - providing additional testament to the U.S. financial sector’s growing disconnect with the real economy.
On the Bank Asset side, Loans increased at a 10.3% pace during the quarter to $5.670 TN, down slightly from Q1’s 10.5%, with Mortgages expanding at a 14.2% rate to $3.132 TN (up from Q1’s 8.8%); U.S. Government Securities holdings increased at a 14.6% pace (vs. Q1’s 13%) to $1.269 TN; and Corporate Bonds expanded at a 21% rate (vs. Q1’s 13.8%) to $747 billion.
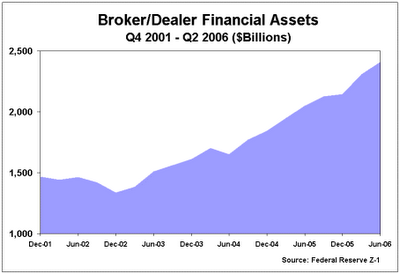
Wall Street Bubble. Broker/Dealer Assets expanded $552 billion SAA during the quarter, a rate of 17.6%, to 2.409 TN. For comparison, Broker/Dealer Assets increased $278 during 2003, $232 billion in 2004, and $299 billion during 2005. Broker/Dealer Assets expanded 17.5% over the past year and 46% over two years. During Q2, Miscellaneous Assets were up $469 billion annualized (37% pace) to $1.454 TN, with a one-year gain of $315 billion, or 27.6%. On the Liability Side, Security Credit expanded at an 18.1% rate to $895 billion; Security RPs 11.3% annualized to $840 billion; and Due to Affiliates 16% annualized to $1.015 Trillion. Over four quarters, Security Credit is up 11.7%, Due to Affiliates 7.1%, and Securities RPs 23.4%.
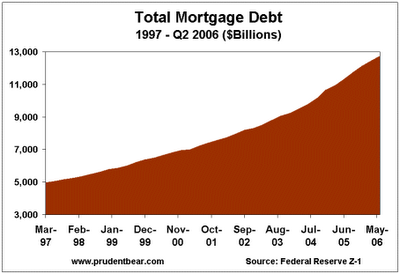
Mortgages remain the asset of choice for Financial Sector leveraging. Total Mortgage Debt increased $1.168 TN SAA during the quarter to $12.758 TN, down from Q1’s $1.313 TN. Still, this compares to the ‘90’s annual average Total Mortgage debt growth of $269 billion and average growth of $889 billion during the first 5 years of the current decade. During Q2, Home Mortgage debt growth slowed to a 9.6% rate (down from Q1’s 9.7% and Q4 ‘05’s 12.9%) to $9.839 TN, while Commercial Mortgage debt growth accelerated to a 13.5% pace (vs. Q1’s 11.5%). Total Mortgage Debt has inflated 12.7% over the past year, 30% over two years, and an astonishing 112% over seven years.
Liabilities increased at an 8.9% rate, while Assets expanded a modest 2.0% pace. Yet, in nominal dollars
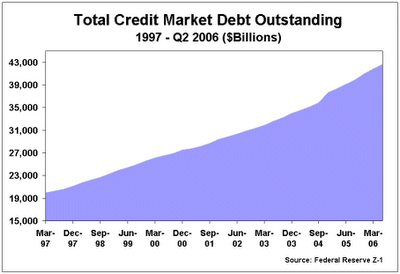
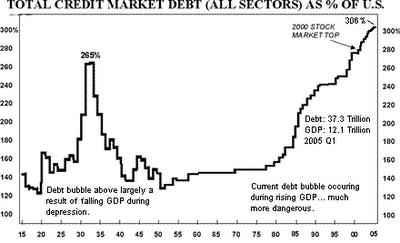
Since the Fed began cutting rates aggressively in early 2001, Total Credit Market Debt has increased $15.8 TN, or 58%, to $42.67 TN (320% of GDP!).
As is reflected in the Q2 2006 Flow of Funds, there remains an overwhelming bias within the financial sector to leveraged existing assets (chiefly government, agency, and mortgage-related securities). This bias has intensified greatly during the third quarter. Ironically, the housing and economic decelerations are to this point engendering only a moderate slowdown in Non-Financial debt growth, while Financial Sector Expansion Goes into Overdrive. The system’s liquidity mechanism has not only become detached from the actual financing needs of the real economy, there is today a Powerful Propensity for Financial Excess to Accelerate Rapidly as the Economy Decelerates Only Moderately (too many waiting patiently to profit from another round of Fed largesse). This is a very important development.
With the debt markets having inflated at a much more rapid pace than the real economy over the life of this Amazing Credit Bubble, Credit and Speculative Dynamics throughout the Financial Sphere Now Significantly Overshadow Those of the Economic Sphere.
The Morgan Stanley Retail Index jumped to a new record high this week, now sporting a y-t-d gain of 10.2% and y-o-y rise of 21.3%. (makes sense.......)
doug noland im interview ca. 30 minuten!
http://www.netcastdaily.com/broadcast/fsn2006-0923-2.asx
jan-martin
die frage aller fragen ist was beeinflußt die assetmärkte am stärksten. meiner meinung nach ist mit abstand an erster stelle der zugang zu kapital/liquidität/krediten und alles was in diesem themenkomplex fällt zu nennen.
unter anderem ja auch ein grund warum die aktienmärkte immer gebannt auf die bondmärkte schauen.
was passieren kann wenn diese versorgung nicht gewährleistet ist kann man schön an allen krisen der letzten jahrzehnte sehen (japan, asienkrise, russlandkrise, ltcm krise etc).
problematisch bei diesem themenkomplex ist das ein großteil dieser krisen immer durch ein vorgelagertes extrem stares kreditwachstum begünstigt worden ist.
meiner meinung nach befinden wir uns zumindest was die usa angeht erneut in einer mehr als brenzliches situation. als belegt einmal diese statistik:
in Q1 2006, $7.50 of additional debt was added to the US economy for each dollar added to real GDP growth, despite the Fed's 16 rate hike
http://immobilienblasen.blogspot.com/2006/08/us-kreditproduktion-luft-amok.html
immer wenn ehrfürchtig vom "tightening" der fed und anderen notenbanken gesprochen wird muß man sich doch sehr wundern das im gleichem zeitraum sich die verschuldung/kreditaufnahme während dieses prozesses noch beschleunigt hat.
A TIGHTENING FARCE by Dr. Kurt Richebächer
http://www.dailyreckoning.com/Issues/2006/DR091306.html
The trouble in the U.S. case is that there never was any monetary tightening. There were many small rate hikes, and the Greenspan Fed had probably hoped that the higher costs of borrowing would exert some restraint on credit demand. But it has not happened. It was a vain hope.
The fact is that the credit expansion has sharply accelerated during these two years of rate hikes instead of decelerating. During 2004, when the Fed started its rate hike cycle, total credit, financial and nonfinancial, expanded by $2,800.8 billion. In the first quarter of 2006, it expanded at an annual rate of $4,392.8 billion
Over the two years of so-called monetary tightening, the flow of new credit has effectively accelerated by 56%. In 2005, credit growth was $3,335.9 billion. Over the whole period of rate hikes, it had steadily accelerated from quarter to quarter. Borrowers and lenders, apparently, simply adjusted to the higher rates, trusting that there would never be serious tightening.
True monetary tightening would have to show first of all in declining "excess reserves" of banks relative to their reserve requirements. These have remained at an elevated level during the rate-hike years of 2004-05
In 1991, when the Fed tightened, credit expansion slowed sharply from $866.9 billion in the prior year to $620.1 billion. A sharp slowdown in credit expansion in 2000 to $1,605 billion also happened, from $2,044.7 billion the year before. Yet this still represented very strong credit growth in comparison with the years until 1997.
Like all central banks, the Federal Reserve has two levers at its disposal to stimulate or to retard credit and money creation. The big lever is its open market operations, buying or selling government bonds, thereby increasing the banking system's liquid reserves. The little lever consists of altering its short-term interest rate, the federal funds rate, thereby influencing the costs of credit.
True monetary tightening has to show inexorably in a slower credit expansion throughout the financial system. There is one sure way for a central bank to enforce this, and that is by curtailing bank reserves through selling government bonds.
The other lever at its disposal, as pointed out, is to influence credit costs. But the influence of the central bank on credit costs begins and ends with altering its short-term federal funds rate. During the past two years, the Fed has raised its federal funds rate from 1% to 5.25%. But long-term rates hardly budged. To the extent that borrowers shifted from the low short-term rate to the long-term rate, they encountered higher borrowing costs. But at the long end, interest rates rose less than the inflation rate.
Here are still a few other credit figures illustrating the Fed's monetary tightening since mid-2004. Total bank credit expanded, annualized, by $957.0 billion in the first quarter of 2006, against $563.5 billion in 2004. For security brokers and dealers, the two numbers were $611.3 billion, against $231.9 billion; and for issuers of asset-backed securities (ABSs), they were $663.3 billion and $322.6 billion. This is monetary tightening à la Greenspan.
Monetary tightening has one purpose: to curb credit expansion fueling the excess spending in the economy and the markets. By this measure, Greenspan's monetary tightening since 2004 has been a sheer farce. During these two years, he presided over a sharply accelerating credit boom, for which the reason is also obvious.
It can be argued that rate hikes in the past have generally worked. Yes, but the central bankers of the past never forgot to tighten bank reserves. Tighter money to them meant tighter credit, and it always showed in sharply shrinking credit figures. So it also has, in the past, in the United States. But this time, the diametric opposite has happened.
von prudent bear / doug noland
http://www.blogger.com/post-create.g?blogID=30868010
Year-to-date, Bank Credit has expanded $508 billion, or 9.5% annualized. Bank Credit inflated $631 billion, or 8.5%, over 52 weeks (down on week)
Commercial & Industrial (C&I) Loans have expanded at a 15.2% rate y-t-d and 13.9% over the past year (down on week)
Real Estate loans have expanded at a 9.7% rate y-t-d and were up 10.2% during the past 52 weeks (down on week)
Total Commercial Paper jumped $18.3 billion last week (7-wk gain of $92.5bn!) to a record $1.882 Trillion. Total CP is up $241 billion y-t-d, or 20.1% annualized, while having expanded $276 billion over the past 52 weeks (17.2%).
“The global credit-derivatives market has more than doubled in the past year to $26 trillion
The global credit derivaties market is expected to grow to more than $33,000bn by the end of 2008,
Total Non-Financial Debt growth did slow from the first quarter’s torrid 9.5% rate down to 6.4% seasonally-adjusted and annualized
It is worth noting however, that federal government borrowings declined 2.4% SAA during the quarter, a sharp reversal of Q1’s 11.3% increase. At 9.1%, Total Household Borrowings remain robust, although down somewhat from the first quarter’s 9.6%. Corporate debt growth slowed to 6.7% from the previous quarter’s 8.8%, while State & Local borrowings accelerated from a 3.5% rate to 6.6%.
For one, Financial Sector Credit Market Borrowings actually accelerated – rising from Q1’s 8.6% pace to a notable 10.2% SAA. This confirms that financial conditions remain extraordinarily loose, as well as suggests that expectations for weaker economic activity only promote greater financial sector leveraging and speculating. In nominal SAA dollars, Financial Sector Credit Market Borrowings expanded at a $1.342 TN pace, up from Q1’s $1.110 TN and Q2 2005’s $1.171 TN. By major instrument category, “Open Market Paper” expanded at $309 billion SAA (18.0% annualized) to $1.475 TN; “GSE Issues” $300 billion SAA (11.5% annualized) to $2.686 TN; “Agency- and GSE-backed Mortgage Pools” $308 billion SAA (6.5% annualized) to $3.814 TN; and “Corporate Bonds” $406 billion (9.7% annualized) SAA to $4.559 TN.
Over the past year, Financial Sector Borrowings increased 9.1%. By Instrument, Open Market Paper expanded 21%, GSE Issues 3.9%, Agency MBS 6.9%, and Corporate Bonds 11.5%. It is worth noting that the pace of Financial Sector Borrowings over the past year has been more than double that of M2 growth (4.4%)
Banking Assets expanded at a SAA $941.4 billion during the quarter to $9.771 TN. For comparison, Bank Assets expanded $350 billion during 2001, $477 billion in 2002, $507 billion in 2003, $748 billion in 2004, and $763 billion during 2005. Bank Credit expanded at a blistering 11.8% pace during the quarter to $7.894 TN, up from Q1’s 11.3% and Q2 2005’s 9.5% - providing additional testament to the U.S. financial sector’s growing disconnect with the real economy.
On the Bank Asset side, Loans increased at a 10.3% pace during the quarter to $5.670 TN, down slightly from Q1’s 10.5%, with Mortgages expanding at a 14.2% rate to $3.132 TN (up from Q1’s 8.8%); U.S. Government Securities holdings increased at a 14.6% pace (vs. Q1’s 13%) to $1.269 TN; and Corporate Bonds expanded at a 21% rate (vs. Q1’s 13.8%) to $747 billion.
Wall Street Bubble. Broker/Dealer Assets expanded $552 billion SAA during the quarter, a rate of 17.6%, to 2.409 TN. For comparison, Broker/Dealer Assets increased $278 during 2003, $232 billion in 2004, and $299 billion during 2005. Broker/Dealer Assets expanded 17.5% over the past year and 46% over two years. During Q2, Miscellaneous Assets were up $469 billion annualized (37% pace) to $1.454 TN, with a one-year gain of $315 billion, or 27.6%. On the Liability Side, Security Credit expanded at an 18.1% rate to $895 billion; Security RPs 11.3% annualized to $840 billion; and Due to Affiliates 16% annualized to $1.015 Trillion. Over four quarters, Security Credit is up 11.7%, Due to Affiliates 7.1%, and Securities RPs 23.4%.
Mortgages remain the asset of choice for Financial Sector leveraging. Total Mortgage Debt increased $1.168 TN SAA during the quarter to $12.758 TN, down from Q1’s $1.313 TN. Still, this compares to the ‘90’s annual average Total Mortgage debt growth of $269 billion and average growth of $889 billion during the first 5 years of the current decade. During Q2, Home Mortgage debt growth slowed to a 9.6% rate (down from Q1’s 9.7% and Q4 ‘05’s 12.9%) to $9.839 TN, while Commercial Mortgage debt growth accelerated to a 13.5% pace (vs. Q1’s 11.5%). Total Mortgage Debt has inflated 12.7% over the past year, 30% over two years, and an astonishing 112% over seven years.
Liabilities increased at an 8.9% rate, while Assets expanded a modest 2.0% pace. Yet, in nominal dollars
Since the Fed began cutting rates aggressively in early 2001, Total Credit Market Debt has increased $15.8 TN, or 58%, to $42.67 TN (320% of GDP!).
As is reflected in the Q2 2006 Flow of Funds, there remains an overwhelming bias within the financial sector to leveraged existing assets (chiefly government, agency, and mortgage-related securities). This bias has intensified greatly during the third quarter. Ironically, the housing and economic decelerations are to this point engendering only a moderate slowdown in Non-Financial debt growth, while Financial Sector Expansion Goes into Overdrive. The system’s liquidity mechanism has not only become detached from the actual financing needs of the real economy, there is today a Powerful Propensity for Financial Excess to Accelerate Rapidly as the Economy Decelerates Only Moderately (too many waiting patiently to profit from another round of Fed largesse). This is a very important development.
With the debt markets having inflated at a much more rapid pace than the real economy over the life of this Amazing Credit Bubble, Credit and Speculative Dynamics throughout the Financial Sphere Now Significantly Overshadow Those of the Economic Sphere.
The Morgan Stanley Retail Index jumped to a new record high this week, now sporting a y-t-d gain of 10.2% and y-o-y rise of 21.3%. (makes sense.......)
doug noland im interview ca. 30 minuten!
http://www.netcastdaily.com/broadcast/fsn2006-0923-2.asx
jan-martin
posted by jmf at 3:43 AM
![]()
![]()
![[Most Recent Quotes from www.kitco.com]](http://www.kitconet.com/charts/metals/gold/t24_au_en_usoz_2.gif)
![[Most Recent Quotes from www.kitco.com]](http://www.kitconet.com/charts/metals/gold/t24_au_en_euoz_2.gif)


0 Comments:
Post a Comment
<< Home