Boom! Bust! Boom? / history of housing busts business week
why? just look at the chart from shiller that shows you that this bubble is by far more dramatic than the previous busts.
but bw does a really good job on showing that "inflation adjustet" some areas never recover for decades.
bin der meinung das die schlüsse der bw noch zu optimistisch sind. guckt euch nur den chart von shiller an und ihr seht wieso.

Check the history of housing busts. Some areas bounce back more strongly than others
http://tinyurl.com/ylnuab
Housing has gone from a sure thing to a complete muddle. Median prices fell nationwide for a second straight month in September, the first time that has happened since 1990, according to a report on Oct. 25. Homeowners don't know whether to sit tight or bail. They have no idea whether they're experiencing the beginnings of a deep bust that will leave a permanent hole in their wealth, or a small hiccup.
There's a lot to learn from history. While national downturns in home prices are rare, we have plenty of experience with busts in local markets. Remember, many regions that have been strong in recent years, such as New York, Boston, and Los Angeles, were mired in slumps in the early or mid-1990s. People who bailed out of them at the bottom are still kicking themselves or blaming their ill-informed spouses.
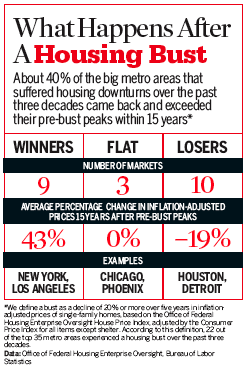
How common is this boom-bust-boom pattern? Over the past three decades about 40% of housing busts in big metro areas have eventually been followed by strong recoveries. That's according to a BusinessWeek analysis of inflation-adjusted housing prices. In an additional 15% of markets, prices adjusted for inflation barely got back to their previous peaks after 15 years. In the remaining 45% or so of markets, prices adjusted for inflation were still down a decade and a half after their pre-bust peaks.

The disparity between winners and losers was striking: Among the winning markets, the average inflation-adjusted gain after 15 years was 43%, while among the losers the average inflation-adjusted loss was 19%.
How do you know if your own local market is the kind that will snap back or the kind that will languish indefinitely? One key factor is the ease or difficulty of building new homes. ....
If the supply-side analysis is correct, it has scary implications for markets like Miami, Phoenix, and Las Vegas, where prices have zoomed in the past several years. Because it's easy to keep up with rising demand by building housing in those areas.....
Moody's Economy.com Inc. has a projection of house prices out to 2015 that shows most of the biggest 10-year gains in apparently cheap markets such as Pittsburgh, Nashville, Houston, St. Louis, and Austin. The forecaster projects small gains for expensive markets including San Diego, Los Angeles, Las Vegas, New York, and Washington.
Economy.com's approach is consistent with textbook economics. But it would have done a bad job of predicting what happened in the past 10 years, wherein the pricey got pricier and the cheap cheaper. For example, even though Houston has had a long stretch of healthy growth, it's so easy to build homes there that inflation-adjusted prices are still 19% below their 1983 peak.
With apologies to the mainstream, the truth is that supply considerations can cause markets to diverge from what seem to be the fundamentals for a long time, perhaps permanently. One explanation for this is the "superstar cities" concept developed by economists Joseph E. Gyourko and Todd M. Sinai of the University of Pennsylvania's Wharton School and Christopher J. Mayer of Columbia Business School. They argue that certain cities -- Boston and San Francisco, say -- benefit from a winner-take-all phenomenon that separates them from also-rans. People all over the world want to own homes in Boston and San Francisco, and the supply is limited. As worldwide wealth rises, there is a bidding war for homes there. No such luck for, say, St. Louis. In fact, according to the authors, the gap between prices in San Francisco and the national average doubled between 1970 and 2000.

größer/bigger http://images.businessweek.com/mz/06/45/0645_66econom_a.gif
In an era of globalization, cities with international reputations can get an edge over blander neighbors if they're perceived as scarce commodities. ..... Miami developers have parlayed the city's international fame into booming sales of condos to Latin Americans and Europeans. But while the uniqueness phenomenon may help growth in those cities, it won't necessarily keep prices up, because it's easy to build: Witness the current glut of Miami condos.
What makes the housing supply inflexible in markets like Boston isn't necessarily a lack of land. Far more often, the cause is regulatory constraints like minimum lot sizes. ......
At this stage in the slump, restricting the supply of housing may sound like a good thing. It's not. Sure, it can make current owners richer by increasing the scarcity value of their homes. But it's murder on first-time buyers. And in the long run, it's bad for the local economy. .....
best city
New York
Previous bust?
Yes, 1992-95 Pre-bust peak: 1988
Inflation-adjusted prices 10 years after pre-bust peak: -25%
Inflation-adjusted prices 15 years after pre-bust peak:+10%
worst city
Cleveland
Previous bust?
Yes, 1982-84Pre-bust peak: 1979
Inflation-adjusted prices 10 years after peak:-19%
Inflation-adjusted prices 15 years after peak: -13%
more details on other cities http://images.businessweek.com/ss/06/10/housing_markets/index_01.htm
![[Most Recent Quotes from www.kitco.com]](http://www.kitconet.com/charts/metals/gold/t24_au_en_usoz_2.gif)
![[Most Recent Quotes from www.kitco.com]](http://www.kitconet.com/charts/metals/gold/t24_au_en_euoz_2.gif)

0 Comments:
Post a Comment
<< Home