"car dealer indikator"
What are Car-Sales Saying About a Recession? According to Floyd Norris of the NYT, potentially alot.
In his column in today's Times, Norris shows the chart below. It reveals the year-over-year rate of change in sales by new-car dealers on a trailing 12 month basis (adjusted for inflation) -- and compares them with recessions.
According to Norris, there is a surprisingly positive correlation when the figure is a negative 2% or greater. The indicators suggests a recession is either "under way or set to begin within a few months." According to the chart, it has never warned of a recession that did not occur: (sogar besser als die warnungen der inversen zinskurve)
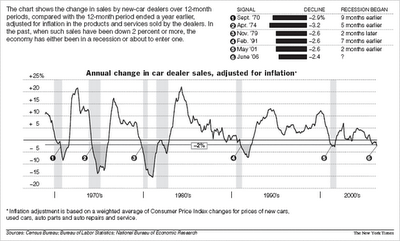
die grauen balken markieren jeweils ne rezession
quelle text und grafik ny times:http://www.nytimes.com/
The rule — unveiled here for the first time — is that if the figure is down 2 percent or more, a recession is either under way or set to begin within a few months. The figure fell to a negative 2.4 percent when June sales figures were released last week by the Census Bureau.
If things are miserable for America’s new-car dealers, can a recession be averted? History says it cannot and suggests a downturn may have already begun.
The available data go back to 1968, a period in which the American economy has recorded six recessions. The “dealer doldrums indicator,” as we will call it, called five of them, missing the 1981-82 recession only because it was not persuaded that the 1980 downturn had ever ended. It has never warned of a recession that did not occur.
The risk of using 12-month figures is that by the time bad news is clear from new-car sales, it can be overwhelmingly obvious from other economic indicators. But such long periods avoid the possibility of false readings because of the volatility of new-car sales.
The chart measures all sales by new-car dealers, which is how the retail sales statistics report the data. So it includes their revenue from used-car sales, parts and service. But it does not include sales by dealers who sell only used cars or repair garages that are not also car dealers.
zum glück ist das ein wenig bis überhaupt nicht betrachteter indikator. bin mir allerdings nach der reaktion der märkte auf die letzten schlechten neews nicht sicher ob dieses nicht auch grund für ne rally wäre...... :-)
gruß
jan-martin
posted by jmf at 12:04 AM
![]()
![]()
![[Most Recent Quotes from www.kitco.com]](http://www.kitconet.com/charts/metals/gold/t24_au_en_usoz_2.gif)
![[Most Recent Quotes from www.kitco.com]](http://www.kitconet.com/charts/metals/gold/t24_au_en_euoz_2.gif)


0 Comments:
Post a Comment
<< Home