Thursday, July 29, 2010

Clevelend Fed "One Measure Of Corporate Leverage Recently Reached A New Historical High"

By now everybody has seen the following chart showing the very impressive cash position of corporates only waiting to be spend on dividends, buybacks, M&A, investments etc..... If you dig a little bit deeper it seems outside a few very strong companies ( mainly tech ) the overall "breath" isn´t quite as strong as reported...... On top of this to my knowledge a not insignificant percentage of the cash is "trapped" outside the US.... Without a special "tax holiday" there is only a very small chance that this money can be used freely..... See 2nd. UPDATE at the end of the post.....

Ich denke jeder hat den nachfolgenden Chart, der die starke Cashposition der US Unternehmen zeigt, inzwischen irgendwo gesehen bzw davon gelesen ( wird ja fast gebetsmühlenartig tagtäglich wiederholt )... Hoffnung der Märkte ist das dieser gigantische Batzen entweden in Form von Investments, Dividenden, Aktienrückkäufen oder Übernahmen den Weg zurück in die Kassen der Anleger und den Wirtschaftskreislauf findet.... Wenn man etwas genauer hinsieht ist ausserhalb einiger extrem starker Unternehmen ( hauptsächlich Technologie ) in der "Breite" nicht alles so rosig wie man allgemein vermuten könnte..... Darüberhinaus ist nach meinem Kenntnisstand ein nicht unerheblicher Teil der Gelder ausserhalb der US "gefangen"..... Ohne eine besondere Steuererleichterung wird keine der Firmen ohne extreme Nachteile ( glaube ca. 30%) über diese Gelder verfügen können.... Habe hierzu noch ein zweites Update am Ende des Postings gemacht.....

US corporate cash FT LEX

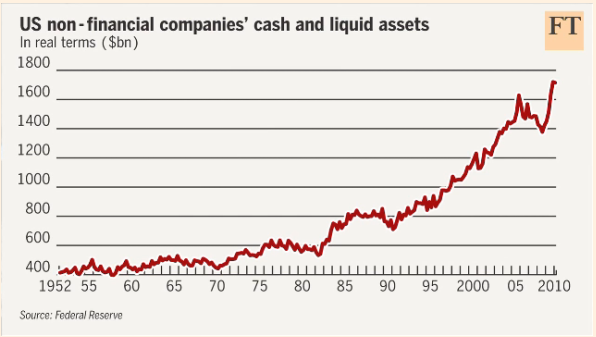
American companies are supposedly flush with cash. Therefore, the optimists say, we should own stocks instead of bonds. Bulging balance sheets should lead either to a mergers and acquisitions boom or, less interestingly, companies can always buy back their own stock. Either way, stocks win.

There is one big problem with this argument; in fact, judged in aggregate, corporate USA’s books are in bad shape. The error is looking at gross cash positions only, ignoring the near doubling in non-financial companies’ leverage since 1982.

Some sectors, such as technology, are genuinely cash rich: the members of the Bloomberg World Technology index have a net $260bn salted away, or 12 per cent of their total market capitalisation.

But, in aggregate, non-financial companies’ cash only covers about 25 per cent of the interest-paying debt on their balance sheets, in line with the norm for the past 40 years.

In the 1950s, companies’ cash covered more than half of their debt.

Corporate Cash: Top 20 Firms = $635 Billion Barry Ritholtz

We found that 3,000 non-financial firms have $1.641 trillion dollars in cash and equivalents.

Other details:

-The top 50 firms are over half of this dollar amount, accounting for $823.642 billion dollars.

-The top 20 firms, ranging from Berkshire to United Health Group account for most of this — $635.386 billion dollars.

-The automakers are another anomaly — Ford (at #3) is showing $46.67 billion dollars in cash — but its against $66.668 billion in liabilities. Even GM’s bankrupt stub Liquidation Motors (# 17) is showing $14.194 billion in cash against $73.934 billion in debt.

-I’m not sure if we should exclude Berkshire Hathaway or GE as financials, but they accounted for $146.644 and $111.176 billion dollars respectively.

Is Debt Overhang Causing Firms to Underinvest? Fed Of Clevelend
One measure of corporate leverage, the ratio of firms’ credit market debt to assets, recently reached a new historical high (see figures 1 and 2).

I assume when you include the pension liabilities / funding levels & "Stresstest the Goodwill" the picture isn´t getting better....

Tippe mal darauf das wenn man die massiv unterfinanzierten Pensionskassen miteinbezieht sowie den Goodwill einem Stresstest unterzieht verbessert sich das Bild nicht merklich.....

UPDATE:

Ending The "Cash On The Sidelines" Fallacy (Redux) ZH


iStockAnalyst


The Biggest Lie About U.S. Companies Brett Arends
American companies are not in robust financial shape. Federal Reserve data show that their debts have been rising, not falling. By some measures, they are now more leveraged than at any time since the Great Depression.

MW-AF721_domest_MD_20100802154926.jpg

S&P 500 Full Year Sources And Uses Of Cash ZH
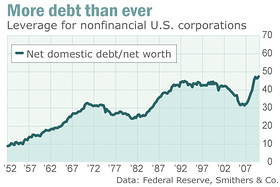
Yet despite consistent claims that companies have massive deleveraged, just $635 billion of debt was repaid, meaning only $35 billion of debt was actually retired! What the flow was used for, however, was to extend maturities, and to shift debt across different sections of the S&P500's balance sheet, lowering the debt cost of capital
I think the charts are showing a nice confirmation that the "breath" is unfortunatley not as strong as would be desirable....

Ich denke diese Charts zeigen leider recht deutlich das die "Breite" leider nicht wie wünschenswert gegeben ist....

2nd Update

Floyd Norris

It was called the “Homeland Investment Act,” and was sold to Congress as a way to spur investment in America, building plants, increasing research and development and creating jobs. It gave international companies a large one-time tax break on overseas profits, but only if the money was used for specified investments in the United States.

The law specifically said the money could not be used to raise dividends or to repurchase shares.

Now the most detailed analysis of what actually happened — using confidential government data as well as corporate reports — has estimated what happened to the $299 billion companies brought back from foreign subsidiaries.


About 92 percent of it went to shareholders, mostly in the form of increased share buybacks and the rest through increased dividends.

There is no evidence that companies that took advantage of the tax break — which enabled them to bring home, or repatriate, overseas profits while paying a tax rate far below the normal rate — used the money as Congress expected.

“Dell was a great example,” she added, referring to Dell Computer. “They lobbied very hard for the tax holiday. They said part of the money would be brought back to build a new plant in Winston-Salem, N.C. They did bring back $4 billion, and spent $100 million on the plant, which they admitted would have been built anyway. About two months after that, they used $2 billion for a share buyback.”

From the B.E.A. data, the researchers were able to calculate that $300 billion in overseas profit was repatriated by American companies in 2005, when they had to pay a tax rate of just 5.25 percent, rather than the normal corporate tax rate of 35 percent. The amount was five times the normal amount of repatriations.

Mmhhh.... After this "spectacular" outcome last time the chances for another tax break are probably not "overwhelming"...

Uh....Nachdem die Ergebnisse beim letzten Mal höflich formuliert "dürftig" waren stehen die Ampeln auf eine ähnlich gelagerte Steuererleichterung nicht gerade auf Grün....

Labels: , , , , ,

Wednesday, July 28, 2010

China : State & Local Owned Enterprises vs Madoff, Ponzi, Enron......

The headline is for sure a little bit "provocative" but at least in part some similarities are difficult to deny.... A nice follow up to Another Reason Why The Chinese Banking Financial Strength Rating Is Just Beating Iceland & Kyrgyzstan..... Looking more & more like an injuste to Kyrgyzstan & Co.....;-)

Die Überschrift ist sicher ne leichte Übertreibung..... Trotz allem kommt man schwer darum herum zumindest in Teilbereichen gewisse Gemeinsamkeiten zu entdecken.....Nette Ergänzung zu Another Reason Why The Chinese Banking Financial Strength Rating Is Just Beating Iceland & Kyrgyzstan..... Inzwischen fast als Beleidigung Islands zu bezeichnen.... ;-)


Just how risky are China’s housing markets? VoxEU
We collected data on all the residential land parcel auctions in Beijing dating back to Q1 2003, and created a constant quality price index for Beijing residential land, controlling for a number of location and site quality variables that are described in Wu et al. (2010).

Figure 5 shows that real, constant quality land values increased by over 750% since 2003 in the Chinese capital, with more than half of that rise occurring over the past two years. Additional regression analysis showed that state-owned enterprises controlled by the central government played a meaningful role in this increase, as prices were 27% higher on the parcels they won at auction compared to otherwise equivalent land sites purchased by other investors.

The role of state-owned enterprises also is potentially worrisome. It could be that these entities are superior investors and are purchasing sites that are of especially high quality in ways that we cannot control for in our empirical analysis. However, it also could be that moral hazard is at work here, as these entities are thought to have access to low cost capital from state-owned banks and may believe they are too big to fail. If this is the driving force, then prices are being bid up as one arm of the government buys from another.
More on the same topic.....

Mehr zum gleichen Thema.....

Meanwhile, in the Chinese property market… FT Alphaville
And once you’ve picked your eyeballs off the floor after seeing that 800 per cent figure, do note the interesting finding about the SOEs.

In particular, the paper says that a ‘meaningful fraction’ of the rise in prices was driven by the few but huge companies backed by central government — ‘central SOEs’. And central SOEs are getting more influential in the market — see chart:

And as the paper continues, by way of explanation:

…Central SOE developers pay high prices relative to the values of nearby housing unit sales prices. That suggests these particular buyers simply pay more and that this does not merely reflect omitted quality effects. Moral hazard arising from these entities believing they are too important to fail, combined with their access to low cost capital from state-owned banks, also could help explain their bidding behavior… It remains an open question as to why central SOE developers became so much more active in housing development over the past few years.


Here Comes The Real Stress: Only 27% Of China Project Loans To Be Repaid In Full ZH
Chinese banks may struggle to recoup about 23 percent of the 7.7 trillion yuan ($1.1 trillion) they’ve lent to finance local government infrastructure projects, according to a person with knowledge of data collected by the nation’s regulator

Local governments set up the financing vehicles to fund projects such as highways and airports due to limits on their ability to directly borrow money. The central government this year restricted borrowing on concern money isn’t being used for viable projects.

Only 27 percent of the loans to the financing vehicles can be repaid in full by cash generated by the projects they funded, the person said

Chinese rating agency criticises … Chinese rating agencies FT Alphaville
July 27 (Bloomberg) — Credit ratings assigned to yuan- denominated bonds issued on behalf of local governments in China are misleading and don’t reflect risks investors face, Dagong Global Credit Rating Co.’s chairman said.

Local government-backed borrowers shop around for the best rankings from Chinese ratings companies and “whoever gives them a better rating gets the business,” Guan Jianzhong, chairman of privately owned Dagong, one of China’s five official ratings agencies, said in a Bloomberg Television interview in Beijing yesterday. “This is very dangerous.”

Needless to say that every large bank has China Inc. as a majority owner.....

Denke man muß nicht extra erwähnen das zudem jeder der großen Banken unter Mehrheitskontrolle des chinesischen Staates steht.....

The PBoC can’t easily raise interest rates M. Pettis / China Financial Markets
One of the problems with a severely repressed financial system, especially one with rapid credit expansion, is that there tends to be a huge amount of capital misallocation supported by borrowing, and in an increasing number of cases it is only the artificially-reduced borrowing costs that allow these investments to remain viable. I worry that even if the PBoC wanted to raise rates, it would not be able to do so without exposing how dependent borrowers are on artificially cheap capital.

Take the most obvious example, the PBoC itself. The central bank officially has about $2.5 trillion in reserves. The PBoC has funded this position with an equivalent amount of RMB liabilities, which makes it very vulnerable to changes in the value of the currency.

Weirdly enough, although the numbers are huge, it has proven difficult to convince anyone that the PBoC is not the richest institution in the world, and that it is actually very vulnerable to big losses

The problem for the PBoC occurs not just because of the currency mismatch but also because it needs repressed funding costs to keep it profitable. How much do the PBoC foreign currency assets earn? I would guess probably between 3% and 4%, maybe less. The RMB funding cost, on the other hand, is roughly between 1.5% and 2.5%. This leaves the PBoC with a net positive carry of between 1% and 2%.

If the RMB appreciates by as little as 2% a year, in other words, the PBoC runs a negative carry on its assets. Every further 1% increase in interest rates, or additional 1% rise in the value of the RMB, then, erodes its capital by at least $25 billion (annually, if it happens through an increase in interest rates).

Many years of very low cost borrowing has created a huge dependency on low interest rates among SOEs, local governments, and other creditors of the bond markets and the banks (not to mention the banks themselves), all of whom are directly or indirectly funded by long-suffering households.

As I discussed in an entry several weeks ago, repressing the interest rate is the equivalent of granting hidden debt forgiveness
Moral Hazard everywhere.....

Moral Hazard wohin das Auge blickt......

UPDATE:

ICBC May Raise $6.6 Billion, Adding to China Bank Share Sales
ICBC’s offer brings to more than $60 billion the amount China’s five largest banks are raising after a record $1.4 trillion in lending last year put pressure on capital levels.

Bank of China Ltd. has also said it plans a CNY60 billion rights issue in Shanghai and Hong Kong and China Construction Bank Corp. is planning a CNY75 billion rights issue in both markets
I assume the term "Drop in the bucket" fits perfectly....

Denke die Bezeichnung "Tropfen auf den heissen Stein" dürfte passen....

Labels: , , , ,

Monday, July 26, 2010

Joke Of The Day From ECB´s Smaghi "€ More Stable Than Deutsche Mark"

Quotes like this totally "neglecting" the almost € 1 trillion fund to "rescue" the €, IMF involvement, first "QE aka Montizing Of Debt" ever & including the once in a lifetime "elevated" ( at least by Bundesbank standarts... ) CPI close to 4% after the reunification are not suitable to regain at least a few percentage points of the already "diminished" credibility... At least in Germany... ;-)

Wenn man Zitate wie diese lesen muß, die zum einen den fast 1 Billion € schweren Rettungsfonds, der zur Stabilisierung des € notwending gewesen ist, und den Sündefall schlechthin ( Aufkauf von Staatsanleihen ) "ausblenden" sowie gleichzeitig die im Zuge der Wiedervereinigung entstandene Sondersituation von extrem erhöhten CPI Daten von knapp 4% komplett unberücksichtigt läßt, muß sich nicht wundern wenn auch noch der kümmerliche Rest in Sachen Glaubwürdigkeit langsam aber sicher "flöten" geht..Zumindest in Deutschland....;-)

Bloomberg

The euro has proven to be a more stable currency than the Deutsche Mark in the 11 years since its introduction, the board member said in the FAZ commentary.

The average inflation rate in those 11 years is lower than in all countries in the monetary union in the 10 years before, even in Germany, Bini Smaghi said, according to the newspaper.

Sometimes it´s better to stay silent.....

"Reden ist Silber, Schweigen ist GOLD".......

Labels: , ,

Friday, July 23, 2010

Only 35% Of Survey Participants Expect The Stess Test To Be Credible....

I´m surprised that the rate is above 20 percent... ;-)

Ich bin ehrlich überrascht das immerhin 35% dem Stresstest eine Aussagekraft zubilligen.... ;-)

Goldman Sachs via FT Alphaville

It’s the results of a Goldman Sachs survey of 376 mostly-European market “participants” ahead of the results

GS Stress Test
H/T Zero Hedge

Get ready for at least a weekend full of spin......

Man kann sich jetzt schon einmal mindestens auf ein Wochenende voller "Spin" einstellen.....

UPDATE:

I assume after the results the percentage of believers hasn´t increased "significantly"....

Kann mir gut vorstellen das nach Bekanntgabe der Ergebnisse die Glaubwürdigkeit des Tests nicht "explosionsartig" hinzugewonnen hat....

Stress Test Results CEBS

5 Cajas ( Spain ), Ate Bank (Greece ), Hypo ( Germany ) failed....
CEBS SAYS 7 BANKS HAD OVERALL SHORTFALL OF EU3.5 BLN OF TIER 1
Stress Test Interactive Graph Spiegel

Apparently Not Too Stressful The Mess That Greenspan Made

Stress test’s sovereign support = senseless
the test parameters being rather cynically calibrated to achieve the desired result.
JPMorgan Shreds The Stress Tests, Says 54 Banks Should Have Failed, And That Investors Will Lose Confidence BI

Gaming the stress tests 101 FT Alphaville

Morgan Stanley On Stress Tests: "Lots Of Missed Opportunities" ZH

Van Steenis European Stress Tests

Labels: , , , , , ,

Twitter Humor

If you are not Steve Jobs & you can withstand some "strong language" you shouldn´t miss this clip....:-)!

Wer nicht Steve Jobs heisst und vor etwas "deftigerer Wortwahl" nicht zurückschreckt sollte sich diesen Clip nicht entgehen lassen.....:-)!

Dilbert.com

H/T Blick Log


H/T Credit Writedowns

Labels: ,

Wednesday, July 21, 2010

SNB Loses 14 Billion Swiss Francs On Euro's Fall

At least they have managed to make a few Hungarian home owners (temporarily) happy.... ;-)

Immerhin hat die SNB es geschafft etlichen ungarischen Immobilienbesitzern ( vorübergehend ) Freude zu bereiten.....;-)

Marketwatch

The Swiss National Bank on Wednesday said the sharp rise of the Swiss franc, particularly against the euro, resulted in exchange-rate losses of more than 14 billion Swiss francs ($13.3 billion)in the first half of 2010.

But income from foreign-currency and Swiss franc positions and the steep rise in the price of gold limited the central bank's first-half loss, which is expected to total around 4 billion Swiss francs, the SNB said.

The SNB, which had intervened heavily in an effort to brake the decline of the versus the Swiss franc, said it increased foreign-currency investments by around 132 billion francs in the first half of 2010, with the bulk placed in euro-denominated investments

Swiss National Bank Confirms Massive FX Intervention Losses, As Spike In M3 Reported via ZH

Following such a massive losses for the small country (nearly 2% of GDP) it was only a matter of time before the other 26 Swiss cantons, which share in the profits and losses of the SNB, said enough.

"The SNB said last month it had stopped intervention. Its official reason was because deflationary risks from the surging currency had declined, but most economists ascribed the move to growing concerns about the risks from the massive foreign currency holdings."

The "success" to weaken the Swiss Franc can be clearly be seen in this chart......

Der "Erfolg" den Anstieg des Schweizer Franken zu verhindern wird im nächsten Chart eindrucksvoll veranschaulicht......

If they continue to fight the inevitable the SNB is on track to beat even their ""GOLDen Masterpiece"....

Sollte die SNB weiterhin versuchen das Unvermeidliche durch Interventionen zu verhindern bzw zu verlangsamen bestehen gute Chancen selbst Ihr bisheriges "Meisterstück" in Sachen GOLD noch zu toppen....

Labels: , , , , ,

Monday, July 19, 2010

Household FX Loans " Eastern Europe Edition"

Definitely a topic that won´t be included in any ( Austrian.... ) stresstest scenario.... Watching this Heat Map showing the foreign ( and mainly European ) bank presence in Eastern Europe i can understand why... ;-)

Mit Sicherheit ein Themenbereich der im "brutalst" möglichen Stresstest ( denke da besonders an Österreich ) keinerlei Beachtung finden wird....Wenn man sich auf dieser Heat Map den "nicht unwesentlichen" Einfluß der überwiegend europäischen Banken in Osteuropa ansieht, verwundert das wenig.... ;-)

BNP via FT Alphaville

[the forint] is under pressure and that around 70% of household loans in Hungary are FX loans (possibly either in swiss franc or euro), putting pressure on consumer balance sheets.

Now a special report only on CHF dominated loans..... You can do the math estimating the € share ( see next table )....

Nachfolgend eine Betrachtung der in CHF begebenen Kredite.... Daraus kann man die Summe in € in etwa ableiten ( siehe Tabelle )....

UBS via ZH

The total amount of outstanding Swiss franc loans to banks and non-banks rose from CHF 228bn in 1999 to CHF 558bn in the third quarter of 2008, before declining to CHF 488bn in 1Q 2010 (see Fig. 1).

To appreciate the magnitude of these figures, consider that the sum of these loans equals around ten times the sum of all Swiss banknotes in circulation (CHF 48 bn in May 2010), and that they are nearly equivalent to Switzerland's nominal GDP of CHF 535bn in 2009.

Further, the sum of franc loans abroad is equal to nearly 70% of the outstanding amount of loans in Switzerland (about CHF 723 bn in April 2010).

The CHF 488bn loans are roughly double the size of the SNB's foreign currency reserves. That means there is a large franc short position outstanding, which more than counterbalances the francs that the SNB has created with its current FX interventions.

Over the past decade, a growing number of foreign households and companies borrowed in Swiss francs to finance their local currency investments. Franc-denominated loans became popular in Austria and Eastern Europe owing to Switzerland's lower interest rates compared with their local currency loans. Moreover, the depreciation trend of the Swiss franc between 2003 and 2007 triggered demand for franc loans in Eastern Europe. As long as the franc weakened, demand for franc loans grew. And, for a time, mortgage payments denominated in francs (due to the weakening franc) became progressively less expensive. We suspect that many of these borrowers failed to anticipate the risk of rapid currency movements.

Since June 2010, the SNB no longer manages the exchange rate with interventions as it believes deflationary risks in Switzerland have largely disappeared. Since mid-June, the Swiss franc has appreciated sharply against all major currencies, which means that servicing franc-denominated debt has becomes increasingly expensive for foreigners.


Absolute amounts of CHF loans outstanding to non-banks: In the Eurozone, Austria has the highest amount with CHF 81bn, followed by Germany (CHF 60bn), France (CHF 30bn) and Luxembourg (CHF 25bn). Outside the euro area, Poland is the leader with about CHF 53bn, followed by Hungary (CHF 36bn), the UK (CHF 23bn), and Croatia (CHF 7bn).

•CHF loans outstanding to non-banks as a share of total loans: The highest share can be observed in Hungary (34%), followed by Poland (20%), Austria (14%), and Croatia (13%).

CHF loans outstanding to non-banks as a share of foreign-denominated loans: the highest share can be observed in Austria •(68%), followed by Poland (65%), Hungary (52%), and Croatia (about 18%).

•Romania and the Baltic states also have large shares of foreign currency-denominated loans, but they prefer the euro or US dollar (see Fig. 3).

Austrians have been borrowing in Swiss francs for more than 15 years (see Fig. 5), while eastern European countries started around 2004. As Hungary, Poland and Croatia have increased their Swiss franc loans aggressively in the last couple of years, the rapid appreciation of the franc and the weakness of their own currencies hurt borrowers in those three countries (see Figs. 6, 7, 8). New borrowers (who requested a CHF loan in 2007 and 2008), are affected more than earlier borrowers, as the latter took out Swiss-franc loans at lower exchange rates


In many cases, the rise of the franc will have lifted the value of the outstanding debt above the value of the asset(s) and made the credit/mortgage shaky.

At some point, franc borrowers might realize that the franc might stay strong for longer, which could induce them to switch their loans. While the franc is affected by many factors, should the borrowers of franc loans at some point decide to switch their loans into local currencies, it could support the franc further, as the borrowers have to unwind their franc short positions.
We therefore conclude that the large amount of outstanding Swiss franc loans to foreign countries remains a threat for the Swiss economy.
Unlike UBS i´m pretty sure that none of the borrowers cares about the stability of the swiss economy .... ;-)

Beim letzten Satz kann ich mir ein Schmunzeln nicht verkneifen... Bin mir ziemlich sicher das keiner der in Franken verschuldeten sich auch nur ansatzweise um die Stabilität der Schweizer Wirtschaft Sorgen macht.. ;-)

Labels: , , ,

Stresstesting The DAX......

A follow up on last years Number Of The Day " Goodwill On Top 133 Listed German Companies Balance Sheets....". Considering that German companies are usually rated as "solid", "conservative" & "prudent" the data is even more "stunning"....

Nettes Update zu Number Of The Day " Goodwill On Top 133 Listed German Companies Balance Sheets...." aus dem Vorjahr. Wenn man bedenkt das besonders Deutsche Firmen weltweit als überwiegend "solide", "konservativ" & "vorsichtig" gelten, finde ich die Daten umso "bemerkenswerter"....


Dax im Stresstest Wirtschaftswoche
The 30 companies listed in the DAX accumulated $ 265 Billion in goodwill. The number has risen almost € 30 billion over the past 2 years.

The total amount equals 5 times the annual earnings from all DAX members.....

180,6 Milliarden Euro an Firmenwerten, 30 Milliarden mehr als noch vor zwei Jahren, schleppen die 30 Dax-Unternehmen heute mit sich herum.

Das entspricht rund fünf Jahresgewinnen aller Dax-Firmen
.
Despite that large part of the M&A was done during the boom years & the deepest recession in decades so far virtually no write downs have occurred....Ignoring "Mark to Market" is not only popular when it comes to the banking industry....;-) I doubt that the worldwide data looks much more favourably..... Keep this at least in mind when it´s again time for another episode of "Wall Street Finest : It´s Always A Good Time To Buy, Buy, Buy....."

Trotz der tiefsten Rezession seit Jahrzehnten sowie der Tatsache das ein Großteil der Übernahmen in den Boomjahren vollzigen worden sind de facto kaum Abschreibungen......Sieht so aus als wenn das Ausblenden von "Mark to Market" nicht nur bei den Banken äußerst beliebt ist.....;-)Tippe mal darauf das die Daten weltweit nicht wesentlich besser aussehen.....Kann nicht schaden sich das zumindest im Hinterkopf zu merken wenn es wieder heisst "Wall Street Finest : It´s Always A Good Time To Buy, Buy, Buy....."

Labels: , , , , , ,

Wednesday, July 14, 2010

Another Reason Why The Chinese Banking Financial Strength Rating Is Just Beating Iceland & Kyrgyzstan.....

A follow up on Chinese Banking Financial Strength Rating Is Just Beating Iceland & Kyrgyzstan..... & "Enron-Esque Characteristics" Hiding An Even More Explosive Credit Growth In China .....

Als Nachschlag zu Chinese Banking Financial Strength Rating Is Just Beating Iceland & Kyrgyzstan..... & "Enron-Esque Characteristics" Hiding An Even More Explosive Credit Growth In China ......
Moody's average rating for their financial strength is D-. On that scale, only six countries are worse off, including Iceland and Kyrgyzstan.

Fitch goes aaaagh on Chinese securitisation FT Alphaville

Frightened with Fitch on Wednesday. The rating agency has looked at where Chinese lending is disappearing to — only to reiterate that rather too much is flowing into the black hole of informal securitisation.

A very black hole, as Fitch explains (our emphasis):

Fitch believes the vast majority of these transactions are not publicly disclosed by Chinese banks, and few, if any, traces of the loans remain in financial statements. The growing popularity of this activity is increasingly distorting credit growth figures at an institutional and system level, resulting in pervasive understatement of credit growth and credit exposure. Consequently, Chinese banks’ loan loss reserves and capital are more exposed to credit losses than current data suggests.

Adjusted for informal securitisation activity, Fitch estimates that the net amount of new CNY loans extended in H110 was closer to CNY5.9trn, or 28% above the official figure of CNY4.6trn. While this difference may seem small when compared to the total stock of CNY loans for banks involved in this activity (roughly CNY34trn at end-June 2010), on a flow basis the volume of credit being shifted off balance sheets in recent times has been large and rising. Activity also is largely concentrated among just a few dozen banks, and institution-specific exposure is often much higher.

Some banks very actively engaged in transactions last year are showing up in 2010 data as minimally involved, yet the bank’s own salespeople (responding to Fitch’s enquiries) state that business remains as strong as ever. Meanwhile, private placements of products to institutional investors are becoming more commonplace, most of which are never disclosed to any entity but the CBRC.

Because of this worsening in disclosure, data from third-party providers is capturing less and less transaction flow, with as much as 40% of deals in H110 going uncaptured, versus less than 10% prior to end-2009.

Although broadly similar, informal securitisation in China differs considerably from traditional securitisations in some critical aspects: asset pools are usually very heavily concentrated; the lack of a secondary market means investors typically must hold positions until maturity; there is no tranching based on credit risk; and the roles of loan originator, product distributor, custodian, and loan manager are frequently commingled, and in practice sometimes all played by a single bank.

Fitch on Chinese Banks; 7/2010

H/T Zero Hedge

China’s trust factor FT Alphaville

First, cash-rich depositors were frustrated with low [bank] deposit rates (around 2% for a one-year deposit), and trust companies were happy to offer 4% or thereabouts, principal guaranteed.

Keep in mind that even the reported CPI is running close to 3 percent......With this kind of "alternatives" in search for yield and a housing bubble already in place ( see Andie Xie: "China's Property Market Is One Of The Biggest Bubbles Ever..." it is no wonder that In Fiat Money We Do Not Trust "Chinese Edition" is getting more "popular"......

Wenn man jetzt noch bedenkt das selbst die offiziellen Daten eine CPI von 3% ausweist und man berücksichtigt das der Immobilienmarkt bereits bis zum Bersten aufgepumpt ist ( siehe Andie Xie: "China's Property Market Is One Of The Biggest Bubbles Ever..." kann es wenig verwundern das die Fraktion In Fiat Money We Do Not Trust "Chinese Edition" deutlich an Popularität gewinnt.....
Second, even though banks’ commissions on these products are low, they did not want their clients going to other banks, so they marketed them enthusiastically. Third, in some cases the banks were able to sell their own loan assets on to the trust company, which repackaged them and then sold them as wealth management products back to the bank’s own clients. This allowed the banks to manage their official outstanding net loan position, which was subject to the loan quota.

Trust loans. These are loans extended by the trust company to one or more borrowers, which are then repackaged and sold on. We understand that quite a few real estate firms have borrowed from trusts at 15-20% annualised interest rates, given the banks’ inability (since late last year) to increase their exposure to this sector. A bank that is unable to lend to a client itself may find a trust company that is willing to lend, and then sell the asset through its own branches . .

The point is, these are sizable positions. StanChart thinks the total amount of lending done by trusts and the total value of repackaged bank loan products issued in the first five months of this year was RMB690bn ($100bn). For context, that’s about a month’s worth of Chinese bank lending.

(Other estimates are even higher. The Economic Observer has RMB2,000bn in the first half of 2010, while the Shanghai Benefit Investment Consulting thinks they were at RMB2,5000bn).

The issue then, is that even as China attempts to curb bank loans — sometimes by literally pulling the plug on them — these trusts have stepped in to fill some of the space left behind.

Small wonder then, that the CBRC is so keen to crack down on the industry to make its lending restrictions effective
.

Red Light Flashes for a Bank Lending LoopholeCaixing Online

Despite the late 2009 orders from CBRC, "trust loans from bank-trust cooperation grew significantly in April and May," a commission official said. "Especially in May, the growth began surging. We often received text messages from banks marketing this type of wealth management product."

On June 1, CBRC convened an urgent meeting with the 12 largest of the nation's approximately 60 trust companies, asking that they slow bank cooperation. They asked that bank-trust cooperation at the end of June not exceed the level of deals posted on April 30.

Statistics from the Yanglee Trust Workshop said 504 bank-trust wealth management products were issued in June – an average 20 products per bank per day – valued at about 777 billion yuan, up 30 percent from May.

The CBRC obviously has a minor credibility issue..... ;-)

Sieht ganz so aus als wenn der Regulierer CBRC nicht ganz für voll genommen wird... ;-)

Labels: , , ,

Monday, July 12, 2010

Japan Pension Fund Becomes Net Government Bond Seller

So far every bet against JGB´s was a disaster.... But is at least not insignificant when the largest buyer for years has turned to a net seller...... I think when you take a look this link, the following presentation, the confident Rating Agencies & yields like this i think it´s safe to assume that the upside for bonds is "not substantial"......

Bisher haben Wetten gegen japanische Staatsanleihen etliche in den Wahnsinn und sicherlich auch in den finanziellen Ruin getrieben... Wenn aber nun der mit Abstand größte Akteur in diesem Segment nach Jahren von einem massiven Käufer zum Verkäufer notiert lässt das zumindest aufhorchen.....Wenn man sich diesen Link , die folgende Präsentation , die ( noch ) optimistischen Rating Agencies & die aktuellen Renditen vor Augen führt darf man sicherlich behaupten das sich das Chance/Risikoverhältnis nicht gerade merklich bessert...

Japan - Past the Point of No Return - By Vitaliy Katsenelson

H/T Barry Ritholtz

Flashback March 2010
The biggest JGB holder on the planet – the Government Pension Investment Fund (GPIF) – which has already admitted it’s no longer able to roll maturing bonds, has announced that it will open credit lines so it doesn’t have to sell them to fund its obligations…
Looks like they had to end the desperate attempt to stop the unavoidable....

Sieht ganz so aus als wenn jetzt der Zeitpunkt gekommen ist wo das Unvermeindliche nicht mehr länger hinausgezögert werden kann.....

Japan Pension Fund Becomes Net Government Bond Seller
July 13 (Bloomberg) -- Japan’s public pension fund sold more government bonds than it bought for the first time in nine years, underscoring concern that an aging population will make domestic investors less able to finance state borrowings.

The fund sold a net 443.2 billion yen ($5 billion) of Japanese government bonds in the year ended March 31, according to Bank of Japan data released last month. It held 79.5 trillion yen of the securities at the fiscal year end, 11.6 percent of the outstanding amount.

The retirement of baby boomers -- defined in Japan as those born between 1947 and 1949 -- may strain the public coffers as soon as 2012, according to Toshihiro Nagahama, chief economist at Dai-Ichi Life Research Institute in Tokyo. “That may be when Japan’s sovereign risk becomes evident,” he said in an interview in May.
So far the € crises has helped to fill the gap......

Da kommt die momentane € Krise ganz passend.....

M.Pettis
China bought a record amount of Japanese government bonds in May, in an apparent move to shift more of its massive foreign exchange reserves into Japanese debt. Chinese net purchases of Japanese government bonds soared to Y735.2bn ($8.3bn) in May, far outpacing the Y541bn in JGBs bought from January to April, according to Japanese finance ministry figures.

It will be interesting to see if or probably better when the BOJ will be "forced" to start QE Version 18 & 19..... With or without QE this alternative looks much more promising.....

Denke der entscheidende Faktor dürfte sein was die BOJ in Sachen QE machen wird.... Dürfte da über die Jahrezehnte wohl dann Version 18.0 & 19.0 sein..... Mit oder ohne QE ich denke diese Alternative dürfte in jedem Fall vielversprechender sein

Labels: , , , , , ,

Sunday, July 11, 2010

Special Gold Report "In Gold We Trust" - Erste Group

Probably the best summary ( 71 Pages full of charts & data ) on GOLD out there... As an example the following chart showing GOLD vs a currency basket that contains equal weights of US dollar, euro, Swiss franc, yuan, Indian rupee, British pound, and Australian dollar

Nicht umsonst wird der jährlich erscheinende GOLD Report ( satte 71 Seiten voller Daten und Charts...) der Ersten Bank als Standartwerk geadelt.....Exemplarisch der folgende Chart der GOLD vs einem gleichgewichteten Währungskorb bestehend aus of US dollar, euro, Swiss franc, yuan, Indian rupee, British pound, and Australian dollar zeigt .... Passend hierzu hat die Wirtschaftswoche ein Interview mit dem Autor der Studie in der aktuellen Ausgabe....

In GOLD We Trust / Special Report Erste Group June 2010


PDF Version

&

Slideshow Version

Labels: ,

Hussman & Hester vs Wall Street Finest.......

Once more brilliant "Anti Spin" & almost a rant from the usually polite Hussman.....Spot on with my take Of Course It Is Still A Good Time To Buy, Buy, Buy..... when it comes to Wall Street Finest.....
There maybe are legitimate reasons to buy stocks, but a favourable opinion from "Wall Street Finest" should definitely not play any role among your screening process .... Except you use them as a "contrary indicator".... ;-)
Einmal mehr deutliche Worte vom ansonsten doch recht zurückhaltenden Hussman....Eine erstklassige Ergänzung zu meinem früheren Posting Of Course It Is Still A Good Time To Buy, Buy, Buy.....
Grundsätzlich mag es ja durchaus gute Gründe die für Aktien sprechen geben, man sollte aber sicherstellen das die Einschätzungen der "Experten" beim Auswahlprozess keinerlei Rolle spielen....Es sei denn man nutzt sie als Kontraindikator.... ;-)

H/T Randy Glasbergen Collection

Misallocating resources John Hussman
On a valuation basis, the S&P 500 remains about 40% above historical norms on the basis of normalized earnings. The disparity between our valuation assessment and the putative undervaluation being touted by Wall Street analysts is so great that a few remarks are in order. First, virtually every assessment that "stocks are cheap" here is based on the ratio of the S&P 500 to year-ahead operating earnings estimates, and often comes with a comparison of the resulting "earnings yield" with the depressed 10-year Treasury yield. What's fascinating about this is that this is the same basis on which analysts deemed stocks to be about 40% undervalued just prior to the 2007 top, following which the market plunged by more than half.

To properly understand the price-to-forward operating earnings ratio, you have to recognize that operating earnings exclude a whole host of charges - what some observers correctly call "recurring non-recurring" charges. These include large and often quite regular losses that the companies deem, often on the thinnest basis, to be detached from their core business - even if the losses are directly related to their core business.
More on this topic in "Reported Earnings vs Operating Earnings"

Mehr zum Thema in "Reported Earnings vs Operating Earnings"

When you hear analysts say that the historical average P/E ratio is about 15, you have to recognize that this is the normal P/E based on trailing 12-month earnings after subtracting all writeoffs and other charges. Forward operating earnings are invariably much higher, and it turns out that the comparable historical norm, as I discuss in that 2007 piece, is only about 12. If you exclude the late 1990's bubble valuations, you get a historical norm closer to 11.5. The 1982 and 1974 market lows occurred at about 6 times estimated forward operating earnings

A final observation is crucial. Current forward operating earnings estimates assume profit margins for the S&P 500 companies that are nearly 50% above their long-term historical norms. While we did observe such profit margins for a brief shining moment in 2007, profit margins are extraordinarily cyclical. Investors will walk themselves over a cliff if they price stocks as if profit margins, going forward, will be dramatically and sustainably higher than U.S. companies achieved in all of market history.

They also ignore the large percentage of reported earnings that are actually quietly distributed to corporate insiders through the issuance of stock and options.

They blindly accept that "share repurchases" are somehow a pleasant distribution of earnings, whereas the majority of share repurchases are actually made by companies to do nothing more than offset the dilution from stock shares and options granted to insiders.

A good question to ask in the years ahead, immediately after profits are reported, is "how much of this figure is actually delivered to shareholders?" If you've been attentive over the past decade, the answer turns out to be much closer to the dividend yield than to the operating earnings yield that companies have reported.

For a moment, at least, it is good to be a corporate insider, particularly at major financial companies.

First, you get to report productivity gains and "operating profits" - not by making smart investments in productive assets, but instead by writing up debt thanks to Treasury intervention, by misstating your balance sheet thanks to FASB changes last year, and at industrial firms, by cutting the number of workers per unit of capital.

Next, you quietly write off large losses on bad investments and unrecoverable loans as "extraordinary expenses," to which investors pay no notice.

And to add insult to injury, you deliver a significant portion of the remaining profits to yourself as "incentive compensation," followed by buybacks of stock to offset the dilution, which investors actually cheer because they don't realize they've been taken for suckers.

Wall Street Earnings Expectations Ignore Economic Divergences Bill Hester / Hussman Funds

The graph below attempts to contrast the erosion in the global PMI indexes against the rising optimism of stock analysts.

Six series of data are plotted: the changes in earnings expected for the companies in the S&P 500 and the Euro Stoxx Index, and four PMI indexes for the US, the Euro area, Germany, and China. Each of the series is indexed to 100 in April, the month where most of the PMI data peaked.

Now take a look at the Chart showing the period between 2007 and 2008 using the same indices.... I highly recommend to read the entire links.... There is much more.....

Hier zum Vergleich der identische Chart für die Zeit von 2007 bis 2008...... Empfehle die kompletten Links zu lesen... Wie üblich findet man dort noch deutlich mehr "Anti Spin"......

UPDATE:

RARE INTERVIEW WITH JOHN HUSSMAN: WHY HE IS BEARISH RIGHT NOW PragCap

Stocks Expected To See 12% Increase In Revenues In Q2, 41% Increase In EPS, And A Summary Outlook From Rosenberg ZH

As for all of 2010, the consensus is at $82 operating EPS, and for a new record to be reached in 2011, at $96 — breaking the record of $88 three years ago. Good luck in seeing a further 30% increase in profits with nominal GDP rising at a 3.0-4.0% annual rate at best in the next six quarters and at a time when margins are already back to cycle peaks.
For the full John Hussman archive visit the blogroll.....

Für eine komplette Auflistung der gesammelten Werke von Joghn Hussman bitte Blogroll beachten.....

Labels: , , , , ,

Tuesday, July 06, 2010

After Dumping 1.300 Tonnes Of GOLD Close To The Bottom During 2000-2005 The Swiss National Bank Makes A U-Turn.....

Nice timing..... Last sale March 2005.......Almost as "good" as Gordon Brown

Da kann man in Sachen Timing nur noch gratulieren..... Der letzte Verkauf ging im März 2005 über die Bühne.....Fast so genial wie einst Gordon Brown

Make sure you click through the SNB presentation from 2005 & see the chart on page 11 with all the sales details..... Judging from the title of the presentation it´s probably time for a less "euphoric" update........ ;-)

Empfehle allen die Präsentation der SNB aus dem Jahre 2005 und insbesondere ab die Charts ab Seite 11 .......Wenn man sich den Titel der Präsentation so betrachtet dürfte es höchste Zeit für eine "Neuinterpretation" sein.....;-)

SNB Gold Sales – Lessons and Experiences
The Swiss National Bank completed its gold selling program of 1300 tonnes on March 30, 2005

Several hundred percent GOLD price & FX reserves increase later.....

Einige hundert Prozent GOLDpreisanstieg & Fremdwährungsreserven später......

FT Alphaville

A look through the FX reserve data shows that much of the fall can be accounted for by an increase in gold holdings. The SNB’s gold holdings at market value went from 39.1bn to 45bn showing an increase of 5.9bn (gold measured in CHF terms was actually down by 4.8% during June).

Thus instead of providing an indication of the SNB’s intervention stance, what we have is interesting insight into the SNB’s portfolio allocation which interestingly is showing a bias toward holding gold

Labels: ,

"Debt Masking" Not Even Mentioned In Finreg......

Oh Boy...... More on "Debt Masking" in "Surprise, Surprise....." Big Banks Mask Risk Levels - Quarter-End Loan Figures Sit 42% Below Peak

Das nennt man dann wohl brutalst mögliche Regulierung.......Mehr zum Thema wie frisiere ich Bilanzen und "Debt Masking" in "Surprise, Surprise....." Big Banks Mask Risk Levels - Quarter-End Loan Figures Sit 42% Below Peak


Interactive Graph : Masking Risk WSJ

Finreg, the FDIC and repo markets: a BarCap primer BarCap via FT Alphaville

One curious absence in this legislation is the lack of any commentary regarding “debt masking” – that is, using repo transactions to reduce balance sheet at quarter-end in order to report lower leverage.

Given all the (bad) press repo has received lately, we thought there would be more explicit language in the bill regarding such activity.

CHUZPAH!

Labels: , , , , ,

Saturday, July 03, 2010

Dilbert vs Wall Sreet Finest 1:0.......

To understand the headline you should read Of Course It Is Still A Good Time To Buy, Buy, Buy..... Almost unbelievable that this link is just one month old......

Um die Überschrift zu verstehen empfehle ich Of Course It Is Still A Good Time To Buy, Buy, Buy..... zu lesen.... Kaum zu glauben das dieser Link erst einen Monat auf dem Buckel hat...

Dilbert.com

H/T Dilbert

UPDATE:

Looks like the guy mentioned in the first link named James Altucher doesn´t even have a rolling forecast ( at least not downwords ) .... He is more than ever in the S&P 500 will hit 1500 camp...Compare the clip with this one from June 2008 just before the big crash Forget Your Fears: 'Everything Is Cheap,' James Altucher Says..."BROKEN RECORD" comes to mind...No wonder even the usually polite Mish has called him "Completely Whacko".... This kind of "expertise" has "earned" him his own Blog label/tag.....I hope his remaining clients use him only as a contrary indicator..... Thank god he is bearish on GOLD ( Quote "It's just a rock.." ).... UPDATE: James Altucher Argues That The Fed Should Intervene Massively In The S&P Futures Market

Nett zu sehen das einer der Typen aus dem ersten Link Namens Altucher zumindest wenn es gen Süden geht nicht einmal im Ansatz einen "rolling forecast" im Repertoire hat... Er ist mehr denn je überzeugt das sein S&P Ziel von 1500 jetzt erst Recht erreicht wird.... Vegleicht den Clip mit dem folgenden vom Juni 2008 kurz brvor sich die Dow & Co halbiert haben Forget Your Fears: 'Everything Is Cheap,' James Altucher Says.. .Damit hat er sich jetz sein eigenes Blog Label/Tag verdient....Bleibt zu hoffen das seine verbliebenden Kunden ihn lediglich als Kontraindikator nutzen....Glücklicherweise ist er in Sachen GOLD weniger positiv...Zitat :"It's just a rock.." UPDATE: James Altucher Argues That The Fed Should Intervene Massively In The S&P Futures Market

Labels: , ,